
Figure 3.
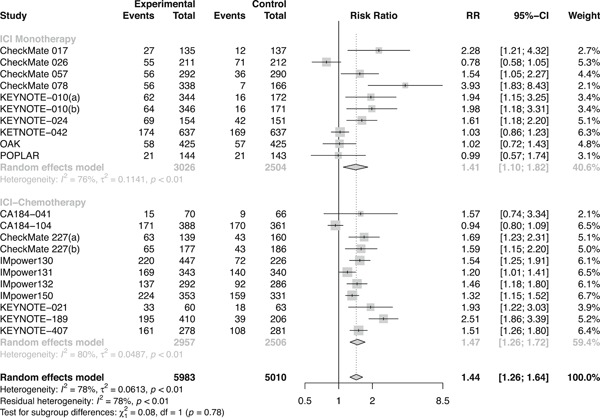
Forest plots of RRs comparing objective response rate between ICI‐chemotherapy and ICI‐monotherapy. CI, confidence interval; ICI, immune checkpoint inhibitor; RR, risk ratio
Official websites use .gov
A
.gov website belongs to an official
government organization in the United States.
Secure .gov websites use HTTPS
A lock (
) or https:// means you've safely
connected to the .gov website. Share sensitive
information only on official, secure websites.
Forest plots of RRs comparing objective response rate between ICI‐chemotherapy and ICI‐monotherapy. CI, confidence interval; ICI, immune checkpoint inhibitor; RR, risk ratio