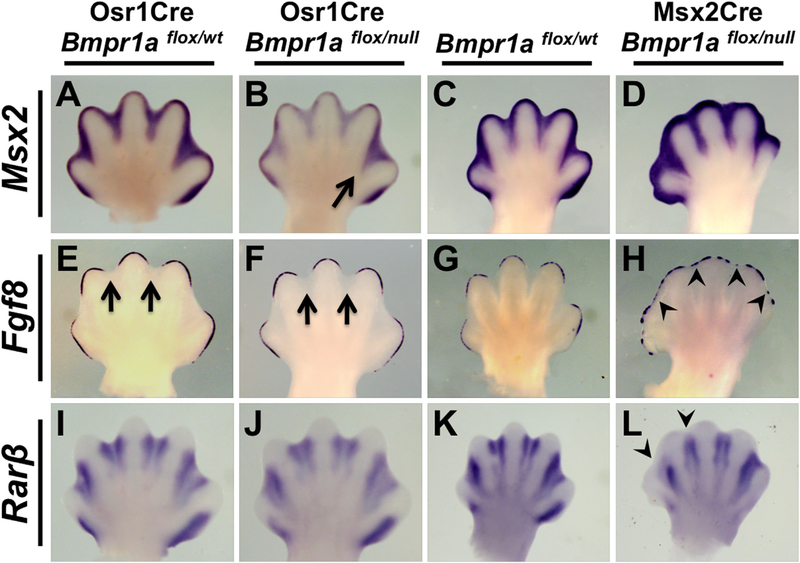
Fig. 5.
Analysis of the BMP, AER-FGF, and RA pathways in mutants with ID- or AER-specific inactivation of Bmpr1a. (A–L) WISH assays using the riboprobe indicated on E13.75 hindlimbs of Osr1Cre; Bmpr1aflox/null (B, F, J) or E13.25 forelimbs of Msx2Cre; Bmpr1aflox/null (D, H, L) and littermate controls (A, E, I, C, G, K). Arrow in B indicates a less severe downregulation of Msx2 expression in ID 4 compared to other IDs. Arrows in E, F indicates normal downregulation of Fgf8 above ID. Arrowheads in H indicate retention of AER-Fgf8 expression overlying ID. Arrowheads in L indicate an absence of Rarβ expression in the distal areas of ID 1 and 2. All views are dorsal with anterior to the left.

