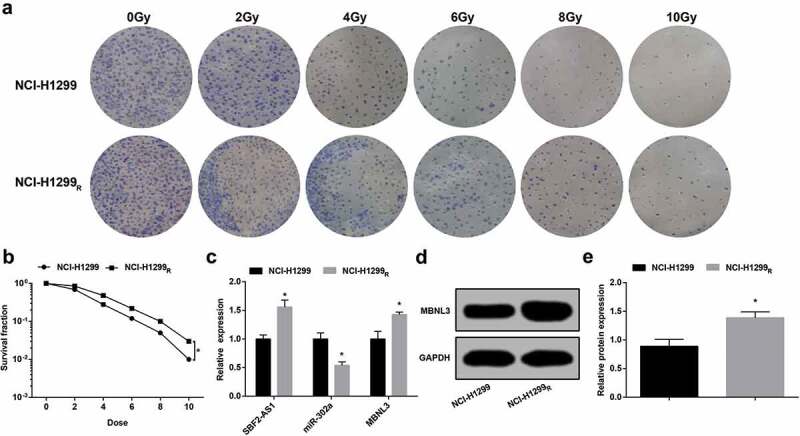
Figure 3.

The resistant cells are more resistant to radiation than the parent cells. (a) Colony formation ability of NCI-H1299 and NCI-H299R cells irradiated with different doses. (b) Survival curve of NCI-H1299 and NCI-H299R cells irradiated with different doses. (c) Expression of SBF2-AS1, miR-302a and MBNL3 mRNA in NCI-H1299 and NCI-H299R cells. (d&e) Protein expression of MBNL3 in NCI-H1299 and NCI-H299R cells verified by western blot assay. N = 3, * P < 0.05 vs. NCI-H1299 cells. Measurement data were depicted as mean ± standard deviation, comparisons between two groups were conducted by independent sample t test.
