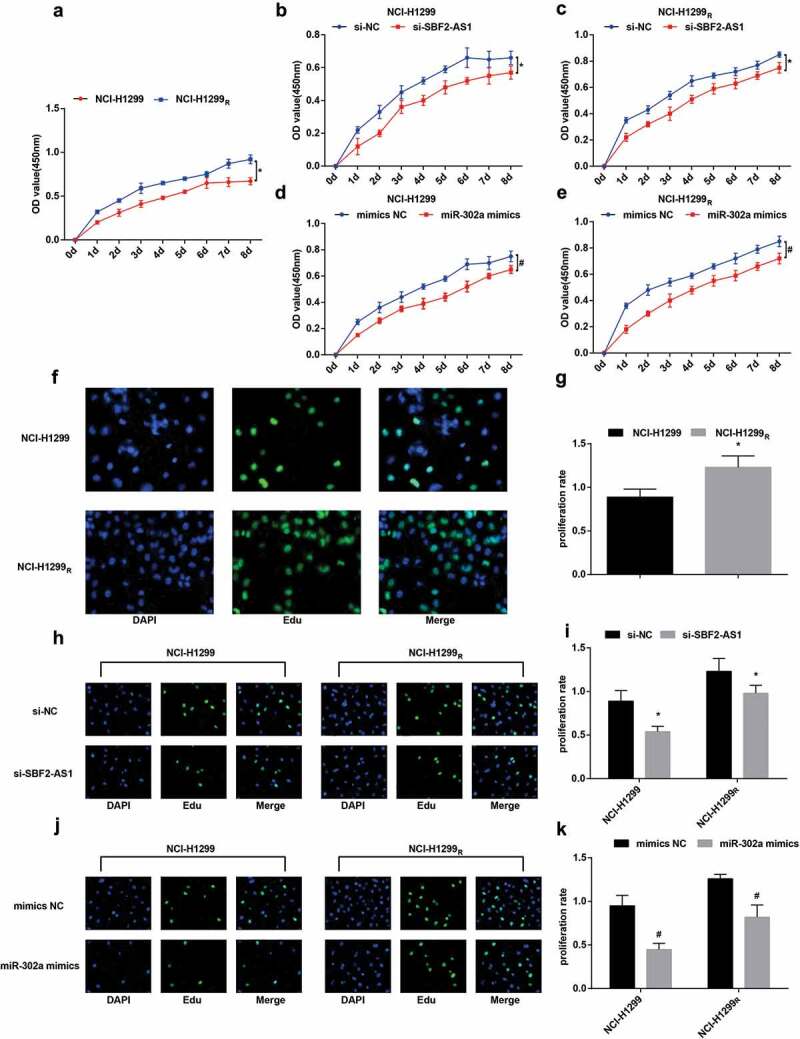
Figure 5.

Down-regulation of SBF2-AS1 or up-regulation of miR-302a inhibits the proliferation of NCI-H1299 cells and decreases the radioresistance of the NCI-H1299R cells. (a) Proliferation curve of parent and resistant strains in NCIH1299 cells. (b) Proliferation curve of the parent strain in the NCI-H1299 cell transfected with si-SBF2-AS1. (c) Proliferation curve of resistant strain in NCI-H1299 cells transfected with si-SBF2-AS1. (d) Proliferation curve of the parent strain in the NCI-H1299 cells transfected with miR-302a mimics. (e) Proliferation curve of resistant strain in NCI-H1299 cells transfected with miR-302a mimics. (f): Detection of DNA replication activity of the parent strain and the resistant strain in the NCI-H1299 cells by EdU assay. (g) Quantification results of DNA replication activity in Figure f. (h) Detection of DNA replication activity of the parent and resistant strains in NCI-H1299 cells by EdU assay after transfected with si-SBF2-AS1. (i) Quantification results of DNA replication activity in Figure h. (j) Detection of DNA replication activity of the parent and resistant strains in NCI-H1299 cells by EdU assay after transfected with miR-302a mimics. (k) Quantification results of DNA replication activity in Figure j. N = 3, * P < 0.05 vs. NCI-H1299 cells in Figure a and g. * P < 0.05 vs. the si-NC group in Figure b, c and i. # P < 0.05 vs. the mimics NC group in Figures d, e and k. Measurement data were depicted as mean ± standard deviation, and data were assessed by independent sample t test.
