Figure 1.

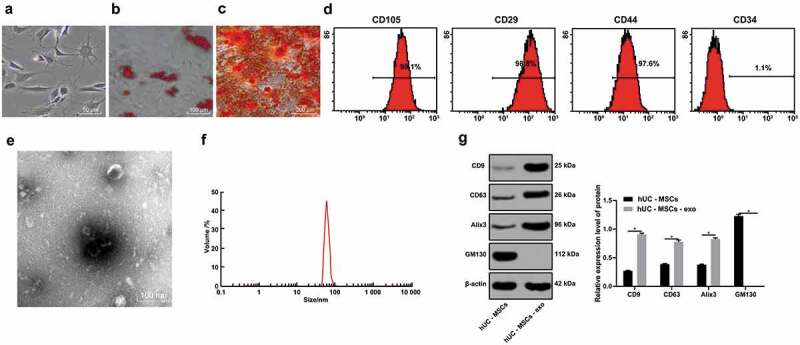
hucMSCs and hucMSC-exo are successfully obtained. (a). Morphology of primary hucMSCs; (b). Cell adipogenesis was induced and red lipid droplets were observed by oil red O staining; (c). A large number of rosy-red calcium nodules were observed during osteogenesis induction by alizarin red staining; (d). Flow cytometry detected the expression of cell surface markers; (e). Morphology of extracted hucMSC-exo observed by TEM; (f). Nanosight NTA measured particle size distribution of hucMSC-exo; (g). Western blot analysis measured hucMSC-exo surface markers GM130, CD9, CD63 and Alix3. For pairwise comparisons, * p < 0.05. The experiment was repeated for three times. Data in panel G were analyzed by two-way ANOVA, and Sidak’s multiple comparisons test was used for pairwise comparison after ANOVA. hucMSCs, human umbilical cord mesenchymal stem cells; hucMSC-exo, human umbilical cord mesenchymal stem cells-exosomes; TEM, transmission electron microscope; NTA, nanoparticle tracking analyzer; GM130, Golgi matrix 130; ANOVA, analysis of variance.
