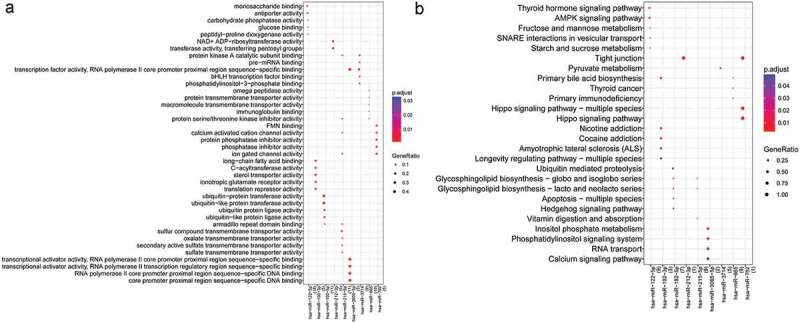
Figure 3.

The result of gene ontology (GO) and Kyoto Encyclopedia of Genes and Genomes (KEGG) pathway enrichment analyses for the miRNAs that the number of target genes≥5. A: GO, lateral axis: miRNAs, numbers in parentheses: the number of genes; vertical axis: the name of GO terms; the size of round dot: GeneRatio, bigger dot represents more miRNAs enriched in this term, smaller p value represents higher significance; B: KEGG, lateral axis: miRNAs, numbers in parentheses: the number of genes; vertical axis: the name of KEGG pathway; the size of round dot: GeneRatio, bigger dot represents more miRNAs enriched in this term, smaller p value represents higher significance.
