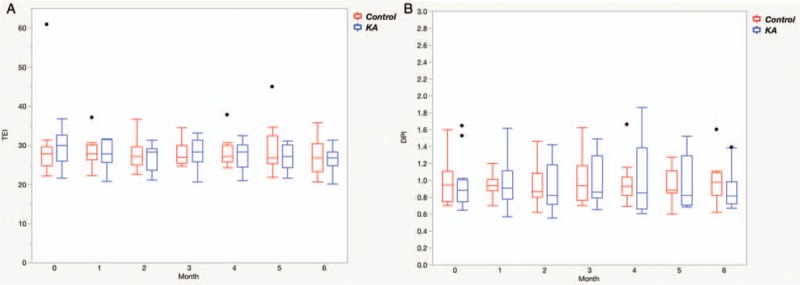
Figure 1.

Estimated total energy intake (kcal/kg/day) (A) and dietary protein intake (g/kg/day) (B) in the control group (n = 14) and in the keto acid group (n = 15) during the 6-month observation period. KA: Keto acid; DPI: Dietary protein intake; TEI: Total energy intake. The black dots represent outliers.
