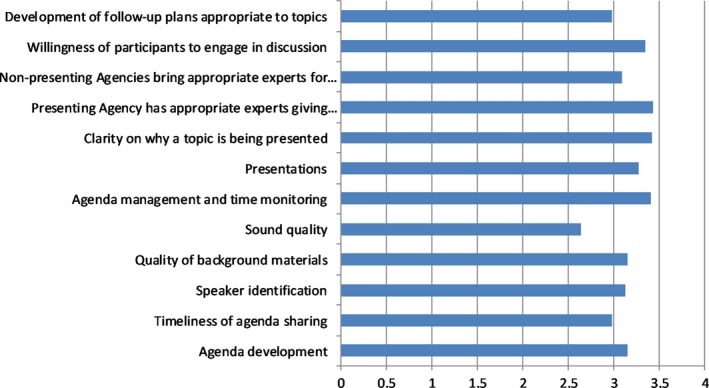
Figure 2.

Quality of clusters rating from 1 to 4 (respondents n = 153). Scale: 1 = could be improved; 2 = ok; 3 = good; and 4 = excellent. Values shown are mean scores for the aggregate of all 20 clusters queried.

Quality of clusters rating from 1 to 4 (respondents n = 153). Scale: 1 = could be improved; 2 = ok; 3 = good; and 4 = excellent. Values shown are mean scores for the aggregate of all 20 clusters queried.