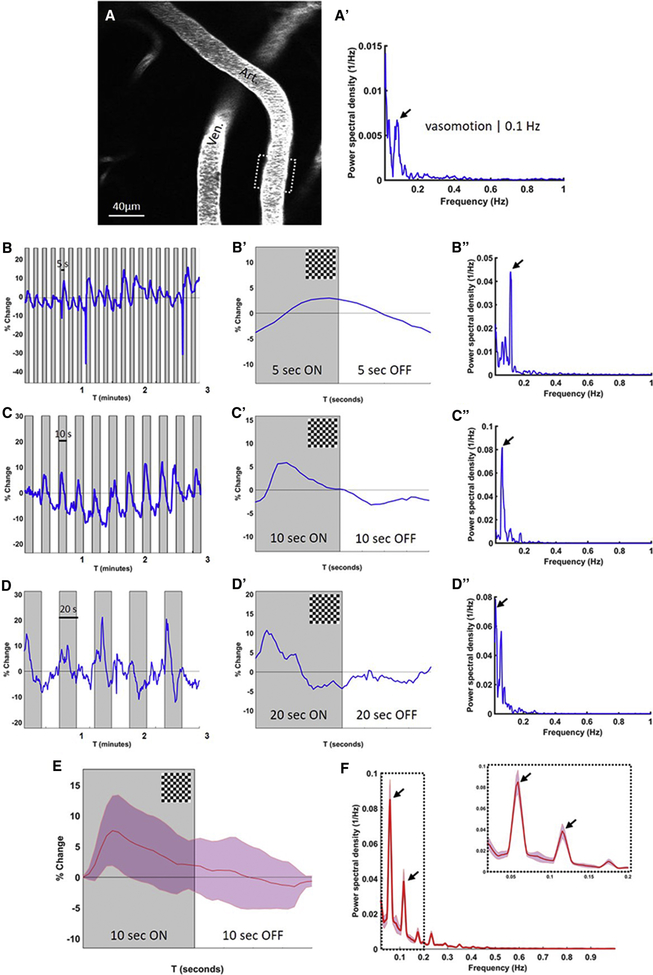
Figure 2. Evoked vascular reactivity can be driven at different frequencies of visual stimulation.
Spontaneous vasomotion is observed in an arteriole in an awake head-fixed wild-type mouse (AA’). Visual stimulation in the form of a flashing checkerboard results in evoked vascular reactivity (functional hyperemia), following distinct patterns of presentation. Presenting the flashing checkerboard pattern for 5 seconds (ON) followed by 5 seconds grey screen (OFF) repeatedly results in vasodilations once every 10 seconds (B), a distinct averaged hemodynamic response function (B’) and a peak in the Fourier distribution at 0.1 Hz (B”). Presenting the checkerboard for 10 seconds (ON) followed by 10 seconds grey screen (OFF) results in a peak at 0.05 Hz (CC’C”), and 20 seconds (ON) followed by 20 seconds (OFF) results in a peak at 0.025 Hz (DD’D”). Note: only the first three minutes of the total 5-minute recordings are shown in panel B, C, and D for optimal presentation of the individual traces. The averaged hemodynamic response function across wild-type mice (n=17 arterioles in 9 mice (for each arteriole ~3 ROIs were averaged)) reveals that the 10 seconds checkerboard ON/OFF presentation reproducibly evokes on average a vessel diameter change of ~7% (E). The corresponding averaged Fourier plot shows a prominent peak at 0.05 Hz (the stimulation frequency) as well as a smaller peak at 0.1 Hz (the vasomotion frequency) (F). Shaded areas in E represent standard deviations. Shaded areas in F represent standard error of the mean.

