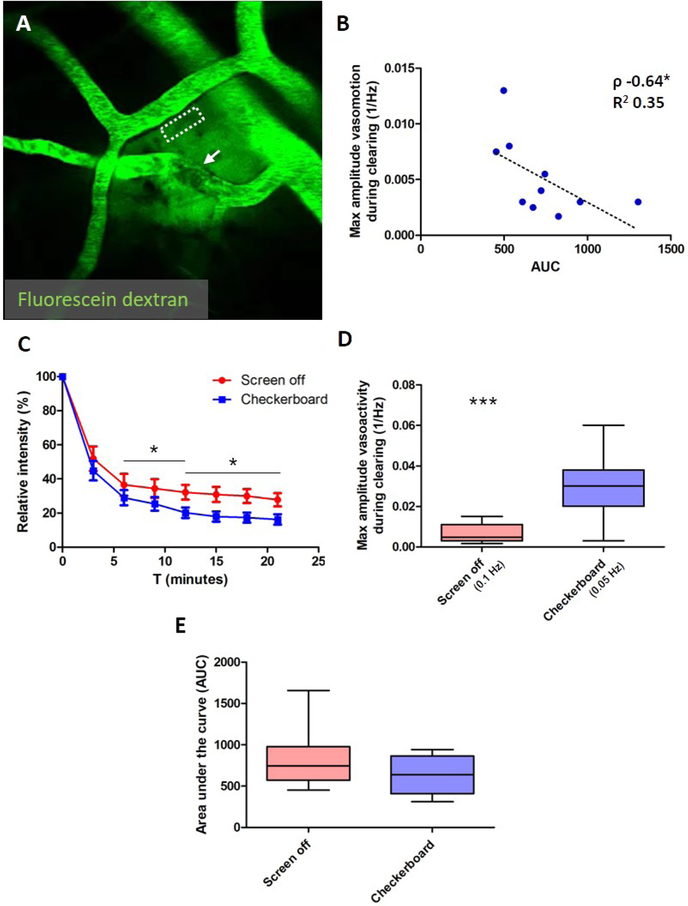
Figure 3. Paravascular clearance rate is associated with vasomotion in wild-type mice.
Clearance of extravasated fluorescent dextran can be measured non-invasively in awake head-fixed mice alongside arteries (dashed ROI) with two-photon microscopy after laser irradiation of neighboring vessels (A; arrow indicates clotting reaction that immediately occurs after the local vessel irradiation). The maximum amplitude of the spontaneous vasomotion (expressed as the power of the peak at 0.1 Hz) per vessel during clearing correlates with the area under the fluorescein dextran decay curve (AUC) (B; Spearman’s ρ −0.64, p=0.049, n=10 vessels in 8 wild-type mice). Note: two measurements were excluded from this analysis due to extensive leakage after laser irradiation. Visual stimulation during the period of extravasated fluorescein dextran clearance resulted in faster clearance rates (C), and can be explained by the significant increase in vasoactivity as quantified by the maximum amplitude of the evoked vascular reactivity (expressed as the power of the peak at 0.05 Hz) per vessel compared to the maximum amplitude of the spontaneous vasomotion (expressed as the power of the peak at 0.1 Hz) when the screen was off (D; 0.027 ± 0.016 1/Hz with visual stimulation (n=11 vessels) vs. 0.0065 ± 0.0046 1/Hz without (n=12 vessels), t-test, p=0.0003). Faster clearances during visual stimulation was quantified as significantly lower relative dextran intensities at t=12 minutes (C; 20.1 ± 10.3 % with visual stimulation (n=11 vessels in 7 mice) vs. 32.2 ± 15.6 % without visual stimulation (n=13 vessels in 9 mice), t-test, p=0.038) and t=18 minutes (C; 17.5 ± 9.7 % with visual stimulation vs. 30.0 ± 14.9 % without visual stimulation, t-test, p=0.026) and AUC (F; 638 ± 226 with visual stimulation vs. 839 ± 341 without, t-test, p=0.11). Error bars in C represent standard error of the mean. Median and range are indicated in D and E. * p<0.05, *** p<0.001.

