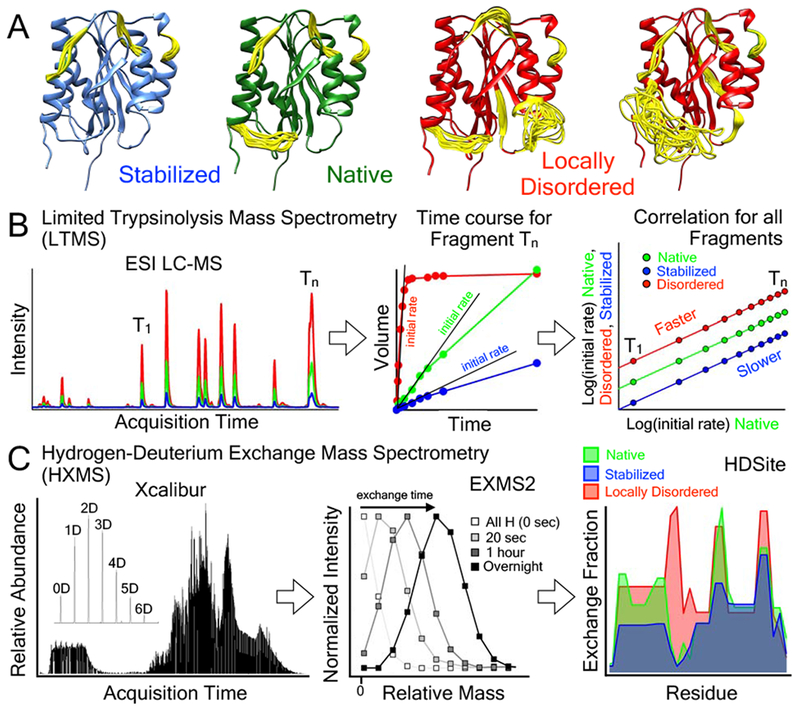
Figure 3:

Mass Spectrometry methods to identify local disorder in VWF. A) Schematic models of the A1 domain (PDB ID = 1AUQ [61]), generated with Mini-Protein MODelling MPMOD [62] and rendered using UCSF Chimera [63]. Yellow loops represent dynamic or disordered regions of the A1 domain experimentally measured by HXMS. B) Schematic representation of the LTMS procedure used to evaluate the local flexibility of the A1 domain containing various mutations. Native, stabilized or locally disordered VWF is incubated with a defined amount of trypsin. Aliquots were taken after certain time points, and after quenching of the proteolysis, peptides were analyzed via RP-HPLC followed by injection into an ESI Mass spectrometer. Accumulation of peptides over time was recorded and initial slopes were determined. A double logarithmic correlation of the slopes of the stabilized and misfolded proteins with the slopes of the native protein provides an estimate for the susceptibility to proteolysis and hence yields insight into structural alterations and local flexibility. C) Procedure for HXMS. Fully hydrogenated protein was incubated in 80% 2H2O to allow the secondary structure dependent exchange of backbone amide hydrogens with solvent deuterium. At various time points, exchange is stopped by a drop in pH. Proteins are cleaved with pepsin and proteolysis peptides are separated and injected into the mass spectrometer. EXMS2 [42,43] is used to identify deuterated peptides and HDSite is used for residue deconvolution [44].
