Figure 5:

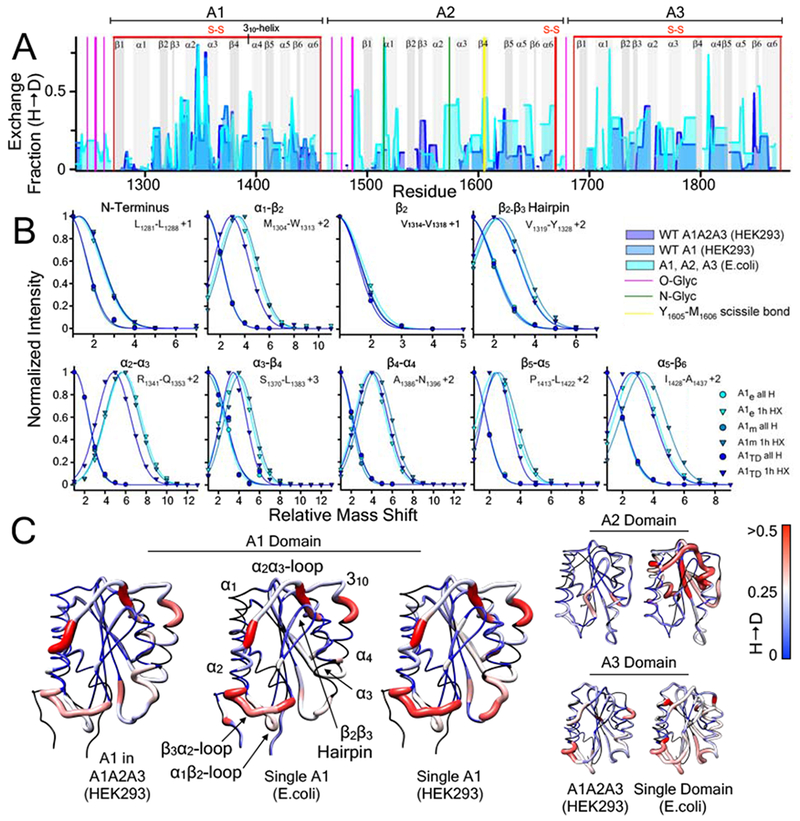
A) 1 hour hydrogen deuterium exchange (H → D) of wild-type A1, A2, and A3 domains (E. coli, cyan area), wild-type A1 domain (HEK293, blue area), and A1 domain within the wild-type A1A2A3 tridomain (HEK293, purple area) as a function of residue position. HXMS of A1, A2, and A3 (from E.coli) and A1A2A3 (from HEK293) were performed in triplicate at 1, 5, 10, 20 and 30 minutes, 1, 3 and 6 hours, and overnight time points. HXMS of A1 (from HEK293) was performed in triplicate at 1 minute, 1 hour and overnight (HXMS Supporting Information). Gray vertical areas represent the indicated secondary structure elements (top). Red vertical lines represent disulfide bonds. Magenta and green vertical lines indicate residues that are O-glycosylated and N-glycosylated respectively. Yellow vertical line represents the Y1605-M1606 ADAMTS13 scissile bond. B) Peptide envelopes (normalized intensity versus mass shift relative to the ”all H” peak) of eight peptides covering various secondary structure regions of the A1 domain expressed in E.coli, HEK293, and within A1A2A3 (HEK293). Relative to the ”all H” peptide at zero time, 1hour HX of peptides in each secondary structure region is observed to be the same regardless of the expression construct. C) HX fraction mapped onto the structures of the A1, A2, A3 domains (pdb IDs 1AUQ [61], 3GXB [64], and 1AO3 [65], respectively). Black = not resolved, blue = 0, white = 0.25, red ≥ 0.5. C) All structures are rendered using UCSF Chimera [63].
