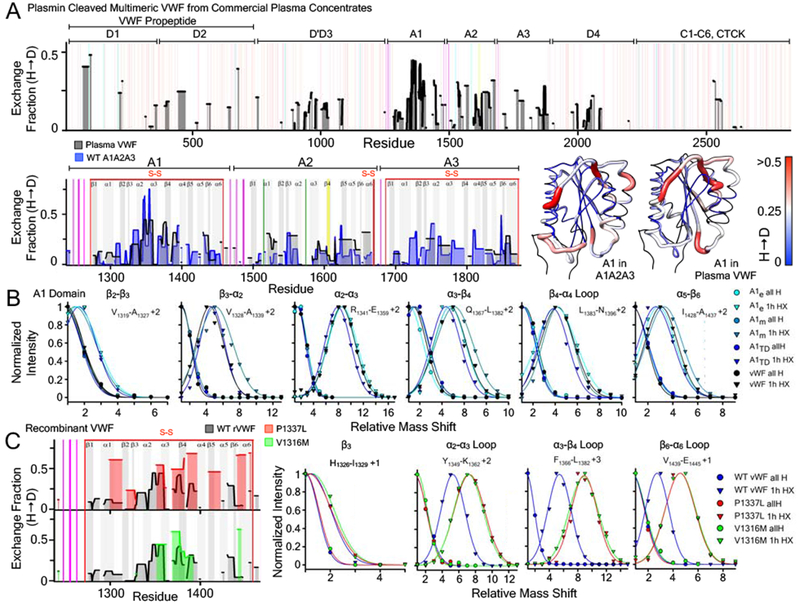
Figure 8:

A) Top: 1 hour hydrogen deuterium exchange (H → D) of multimeric VWF isolated from plasma concentrates (black area) as a function of residue position. Red vertical lines represent disulfide bonds. Magenta and green vertical lines indicate residues that are O-glycosylated and N-glycosylated respectively. Yellow vertical line represents the Y1605-M1606 ADAMTS13 scissile bond. Bottom Left: Comparison of the HX obtained from the A1A2A3 tridomain (blue area) with that of plasma VWF (black area) within the A1, A2, and A3 domains. Bottom Right: HX fraction mapped onto the structures of the A1, A2, A3 domains (pdb ID 1AUQ [61]) is remarkable similar despite the lower resolution of the HX obtained from plasma VWF. B) Peptide envelopes (normalized intensity versus mass shift relative to the ”all H” peak) of six peptides covering various secondary structure regions of the A1 domain expressed in E.coli, HEK293, within A1A2A3 (HEK293), and in VWF isolated from plasma concentrates. Relative to the ”all H” peptide at zero time, 1hour HX of peptides in each secondary structure region is observed to be the same regardless of the recombinant expression construct or the plasma VWF. C) Left: Effect of VWD mutations (P1337L (red), V1316M (green)) on the hydrogen deuterium exchange (H → D) of the A1 domain within recombinant multimeric VWF (HEK293). Right: Peptide envelopes (normalized intensity versus mass shift relative to the ”all H” peak) of four peptides covering various secondary structure regions of the A1 domain in recombinant VWF. Variants are observed to increase the exchange in peptide envelopes indicating an enhanced local disorder of A1 in these structural regions.
