Figure 3.

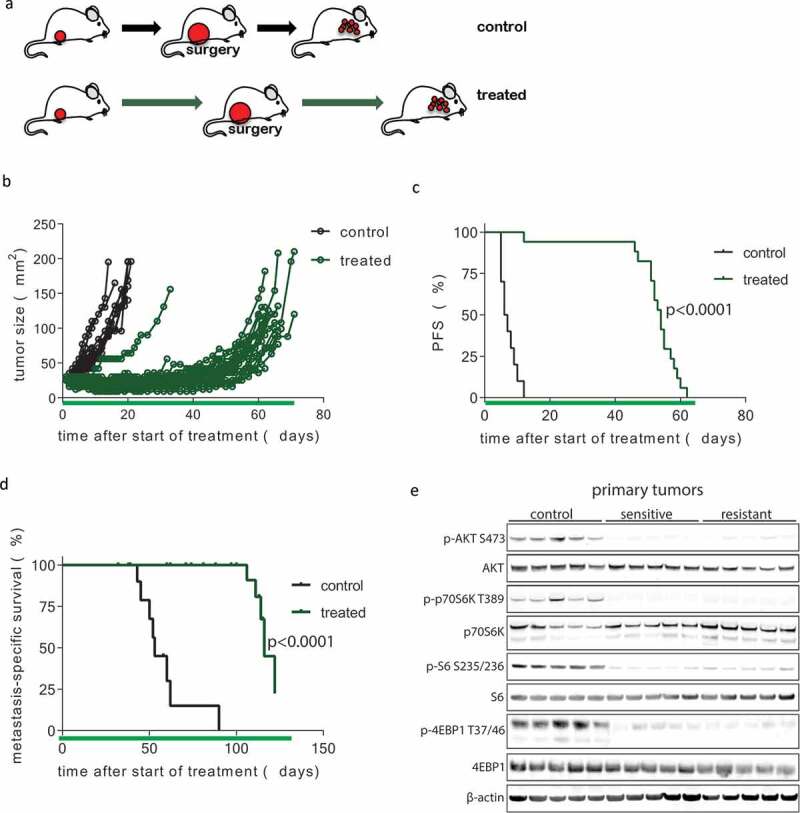
Development of resistance following prolonged neoadjuvant and adjuvant mTOR inhibition. (a) Schematic overview of experimental setup. Tissue fragments (1 mm3) of a mILC from a KEP donor mouse were orthotopically transplanted in recipient mice. Neoadjuvant treatment with daily oral AZD8055 (green arrows) or vehicle control solution (black arrows) was started when tumors reached a diameter of 5 mm. Tumors were surgically removed when they reached a diameter of 15 mm and treatment was continued in the adjuvant setting until mice were sacrificed due to terminal metastatic disease. (b) Individual tumor growth curves in AZD8055-treated mice (green curves, n = 24) and control mice (black curves, n = 10). (c) Kaplan-Meier plot depicting progression-free survival (PFS) of neoadjuvant AZD8055-treated mice (green curve) and control mice (black curve), with progression defined as a doubling in the size of the primary tumor in mm2 from the start of treatment (time point zero). (d) Kaplan-Meier plot depicting metastasis-specific survival in AZD8055-treated mice (green curve) and control mice (black curve). Time point zero indicates start of treatment (tumor size 5 mm) in all graphs. (e) Immunoblot for mTOR signaling markers in five surgically removed tumors from control mice, five therapy-sensitive tumors harvested from AZD8055-treated mice after 5 days of treatment, and five surgically removed therapy-resistant tumors from AZD8055-treated mice.
