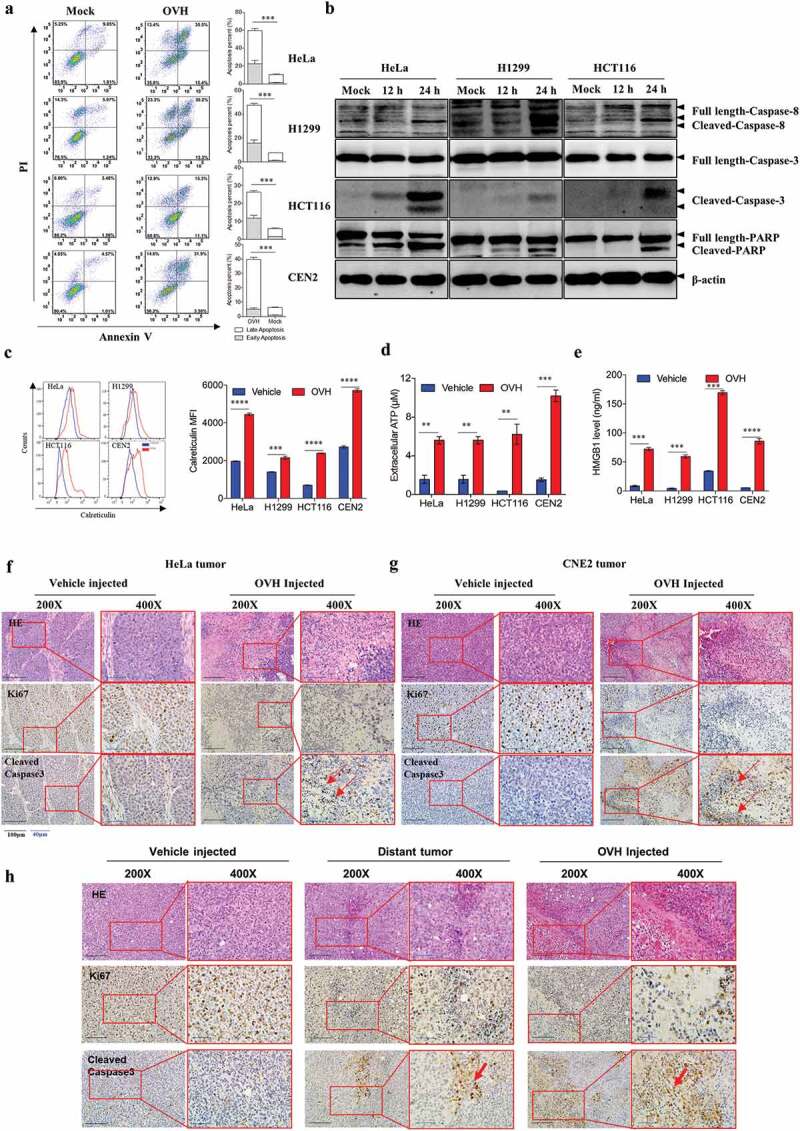
Figure 5.

OVH triggers immunogenic cell apoptosis in susceptible tumor cells. (A) Determination of the levels of apoptosis in HeLa, H1299, HCT116 and CEN2 cell lines left uninfected or infected with OVH at an MOI of 0.5 PFU/cell for 48 h using annexin-V/PI-labeled flow cytometry. Graphs represent pooled data from three independent experiments. (B) Western blot analysis of the expression of full-length and cleaved caspase-8, caspase-3 and PARP in infected HeLa, H1299, HCT116 cell lines at 48 h after virus infection. (C-E) HeLa, H1299, HCT116 and CEN2 cell lines were either left uninfected or infected with OVH at an MOI of 1 PFU/cell. Cells and supernatants were harvested at 48 h post-infection. The surface expression of calreticulin was determined by flow cytometric analysis of the cells (C), and the levels of released ATP (D) and HMGB1 (E) were determined by analysis of the supernatants. (F-G) H&E and IHC analysis of an apoptotic marker (cleaved-caspase3) and proliferation marker (Ki67) in human xenograft HeLa tumors (F) and CEN2 tumors (G) at 24 h after receiving intratumoral injection of two doses of OVH (1 × 10⁷ PFU per dose) or vehicle. (H) Mice were s.c. inoculated with Hepa1-6 cells in both flanks and received intratumoral injection of a single dose of OVH on the right flank (1 × 10⁷ PFU per dose) or vehicle. H&E and IHC analysis of an apoptotic marker (cleaved-caspase3) and proliferation marker (Ki67) in both flanks of Hepa1-6 xenografts (virus-injected tumor and distant tumor) at 5 days after treatment. H&E and IHC images were obtained using a microscope (OLYMPLUS), with indicated objectives. Values are the means of three independent experiments, data are shown as means ± SEM. **P < .01, ***P < .001, ****P < .0001, ns, not significant by unpaired two-tailed Student’s t tests.
