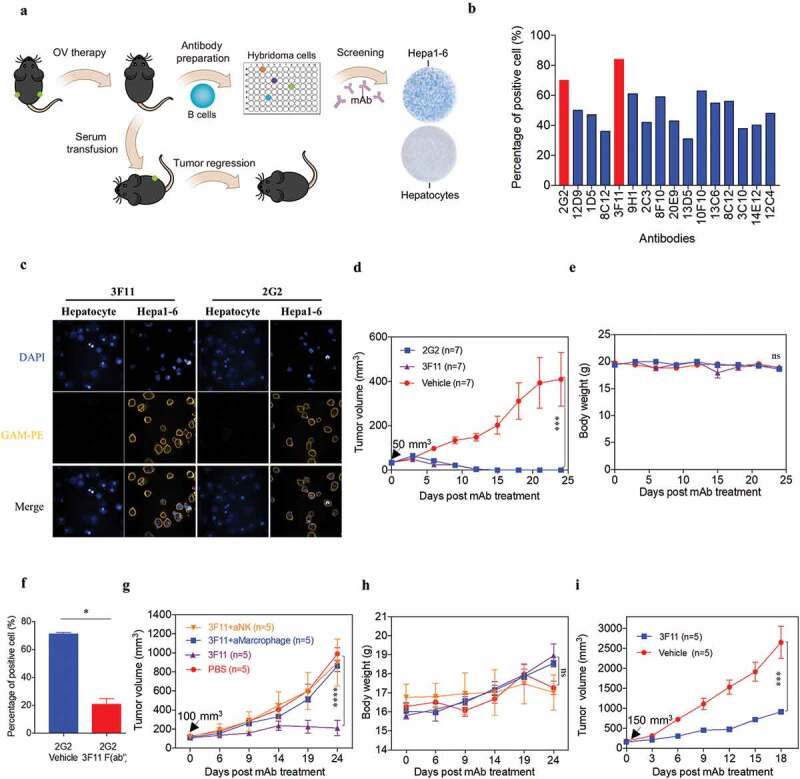
Figure 8.

OVH therapy induces endogenous tumor-specific antibody responses. (A) Schematic diagram of Hepa1-6-specific mAb generation from OVH-cured Hepa1-6 mice. (B) Sixteen mAbs were selected from C57BL/6 spleen×sp2/0 hybridomas, which specifically recognized Hepa1-6 tumor cells and did not cross-react with mouse primary hepatocytes. (C) Hepa1-6 cells and mouse primary hepatocytes were stained with each mAb (3F11 or 2G2) and PE conjugated anti-mouse IgG (Fc specific) antibody, then analyzed by flow cytometry. Representative images of cells stained with each mAb were shown. (D, E) Evaluation of the antitumor effects of 3F11 and 2G2. Tumor growth (D) and body weight (E) were monitored over a 24-day period. (F) Competitive binding assay between 3F11 and 2G2 against Hepa1-6 cells. Hepa1-6 cells were incubated with 2G2 and 3F11 F (ab’)2, then stained with PE conjugated anti-mouse IgG (Fc specific) antibody and analyzed by flow cytometry. (G) Tumor growth was monitored after depleting antibodies specific for the indicated surface markers (n = 5 mice per group). (H) Body weight was monitored over a 24-day period. (I) Evaluation of the antitumor effects of 3F11. Tumor growth was monitored over an 18-day period. Black arrow indicates initial tumor volume for treatment. All values are presented as the mean ± SEM. *P < .05, ***P < .001, ****P < .0001, ns, not significant by repeated measure ANOVA (D, E, G, H, I) or by unpaired two-tailed Student’s t tests (F).
