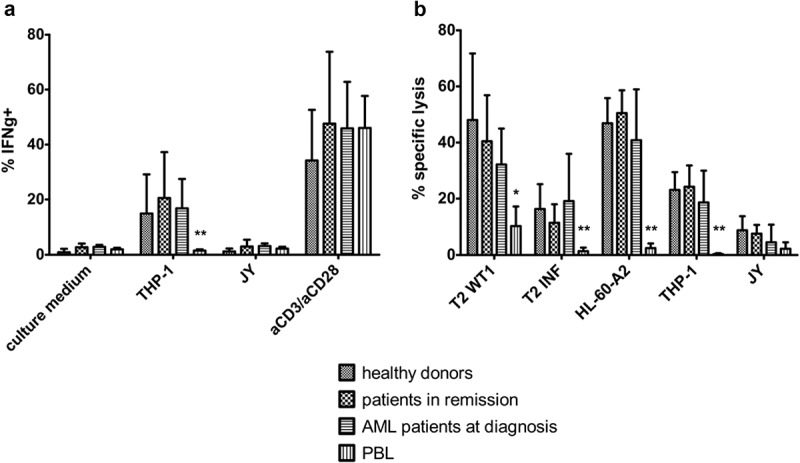
Figure 5.

In vitro generated TA-specific T-cells specifically recognize and kill TA-expressing cell lines. (a) Intracellular staining of T-cells for interferon-gamma (IFNg) after co-culture with THP-1 (HLA-A2+ WT1+) or JY (HLA-A2+ WT1−) cells. Culture medium was used as a negative control, stimulation with aCD3/aCD28 as a positive control. Effector/target ratio 1/2. Gating on eGFP+ TCR-transduced cells. T-cells generated from HSPC from healthy donors (n = 4), patients in remission after chemotherapy (n = 5), AML patients at diagnosis (n = 4) and PBL (n = 6). (b) Percentage specific lysis determined via 4-h 51chromium release assay after co-culture of T-cells with T2 cells pulsed with relevant WT1 or irrelevant influenza (INF) peptide (10 µg/ml), HL-60-A2 (HLA-A2+ WT1+), THP-1, or JY cells. Effector/target ratio 10/1. T-cells generated from HSPC from healthy donors (n = 6), patients in remission after chemotherapy (n = 7), AML patients at diagnosis (n = 8) and PBL (n = 6). For (a) and (b) mean and s.d. are shown. Kruskal–Wallis test was used to determine statistical significance between different HSPC sample groups. Differences were not significant. Mann–Whitney U test was used to determine statistical significance for between-group comparisons for HSPC- and PBL-derived T-cells. P-value < 0.05 (*) and P < 0.01 (**).
