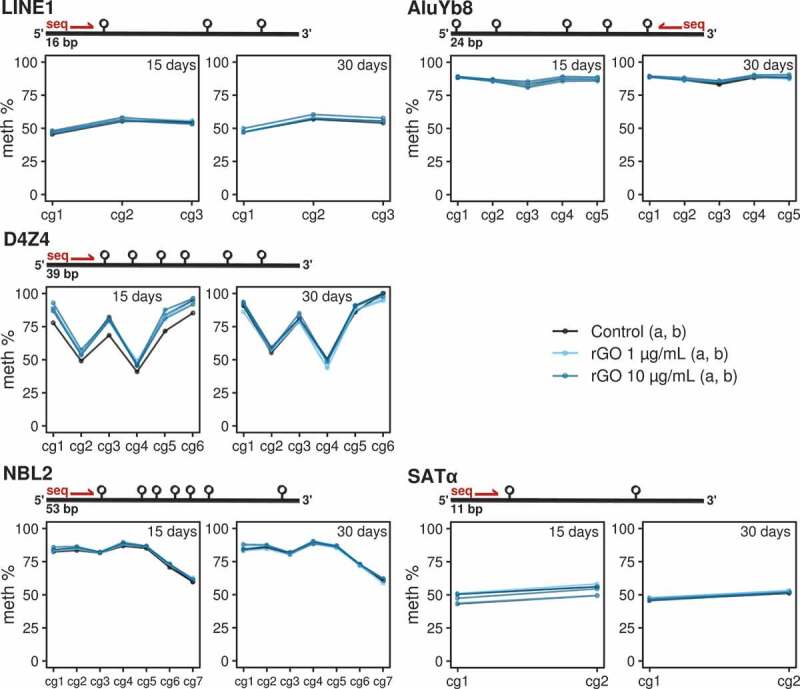
Figure 4.

Line/point plots describing the DNA methylation values of different repeat elements measured by bisulphite pyrosequencing. For each experimental condition, the 2 technical replicates (‘a’ and ‘b’) are plotted as independent lines. For each DNA repeat region, a different number of CpGs were analysed. Values for the 15-day treatments at 0, 1 and 10 μg/mL concentrations and 30-day treatments at 0, 1 and 10 μg/mL concentrations are separated in 2 different plots.
