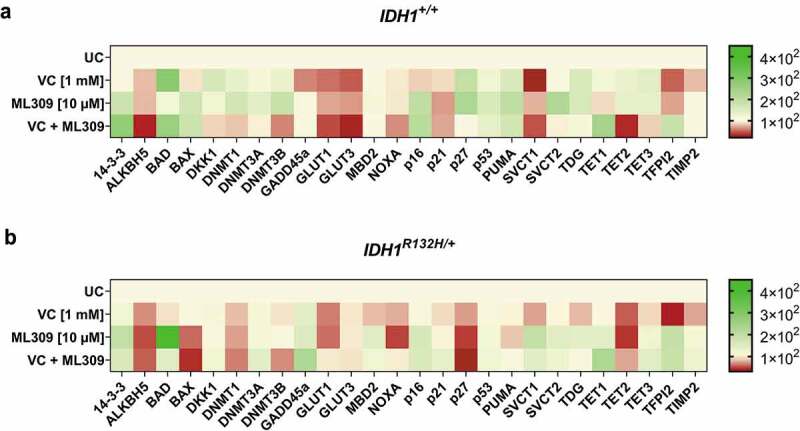
Figure 5.

Gene expression profile of 25 genes after single or combinatorial treatment with VC and ML309 for 48 h in IDH1+/+ and IDH1R132H/+ cells.
Heat map of relative mRNA-levels of the differential expressed genes in (a) IDH1+/+ and (b) IDH1R132H/+ cells after treatment with VC (1 mM), ML309 (10 µM) and combinatorial treatment. (relative to the HMBS housekeeper gene, using the 2ΔΔCT method)
