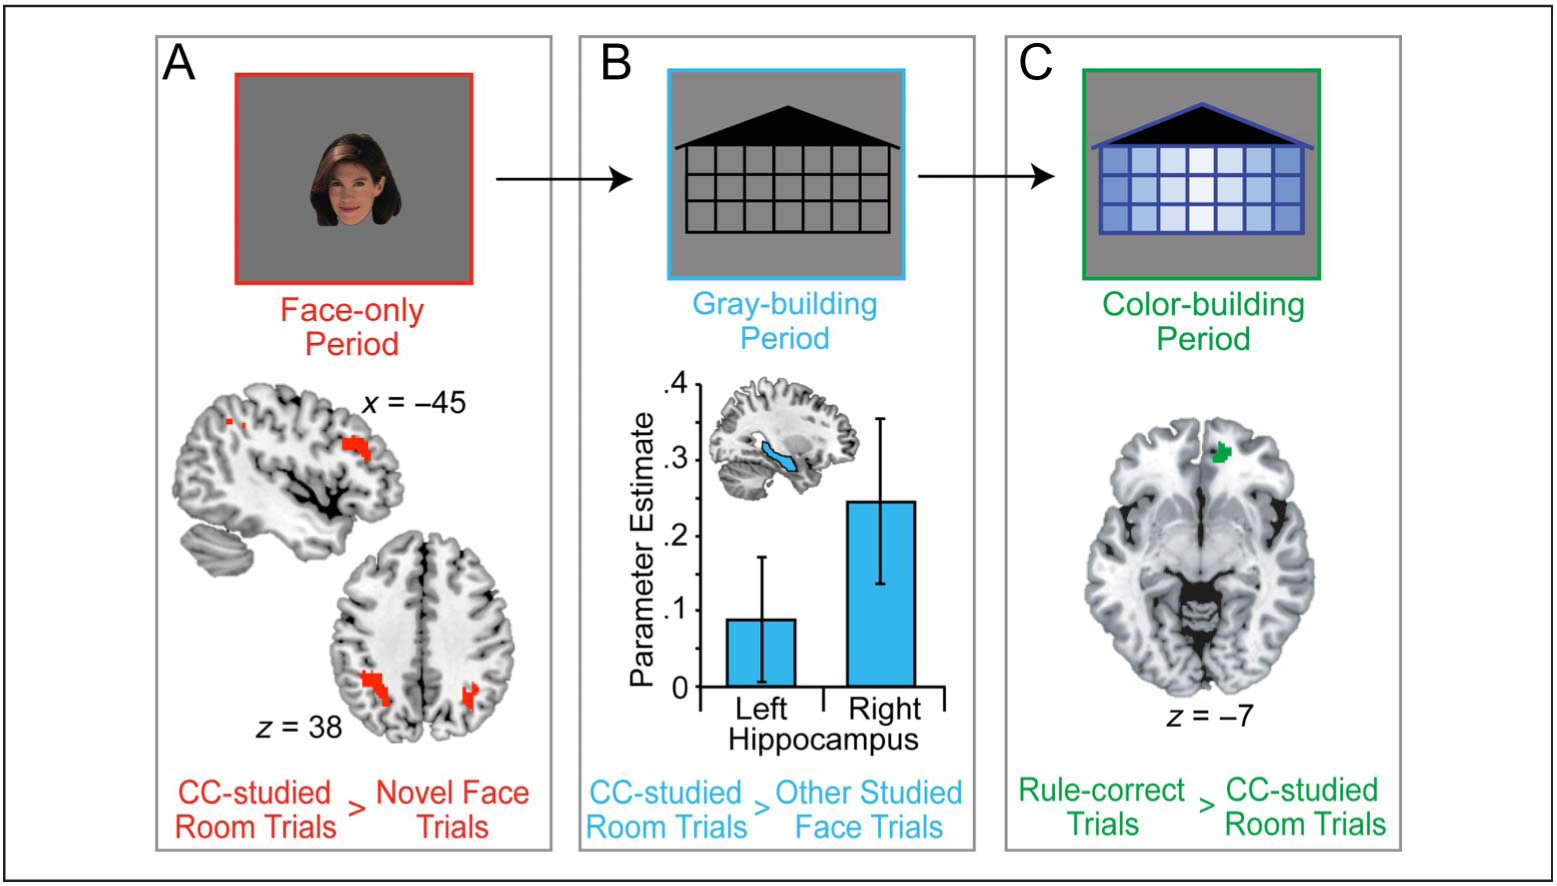
Figure 4.

fMRI results.(A) Activation maps comparing CC-studied room trials with novel face trials (old/new effect) during the face-only period.(B) Hippocampal ROI analysis comparing CC-studied room trials to all other studied face trials during the gray-building period. (C) Activation maps comparing trials where participants relied on rule information to CC-studied room trials during the color-building period.
