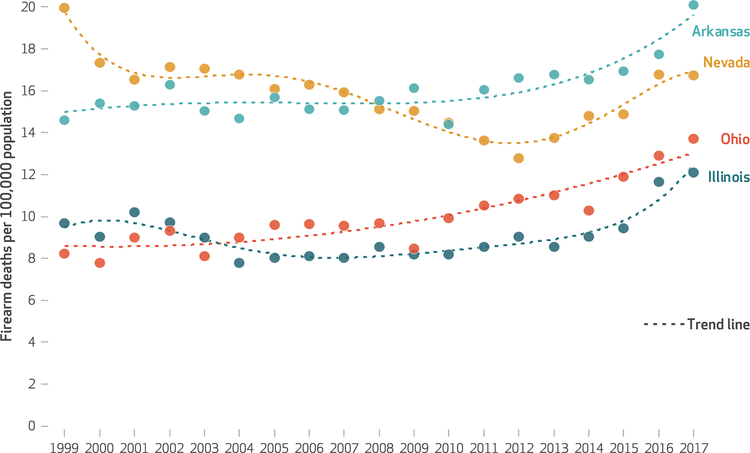
EXHIBIT 4. Age-adjusted firearm mortality rate trajectories in four states, 1999–2017.
SOURCE Authors’ analysis of data for 1999–2017 from the Wide-ranging Online Data for Epidemiologic Research (WONDER) tool maintained by the Centers for Disease Control and Prevention. NOTES The trend lines were superimposed to smooth out the year-to-year fluctuation in the data. The states selected for this exhibit were chosen as typical examples of the three most common growth patterms—nearly linear increase (Ohio), a plateau followed by an increase (Arkansas), and a roughly bowl-shaped trajectory (Illinois)—and, in addition, a nonlinear but generally decreasing trajectory (Nevada).

