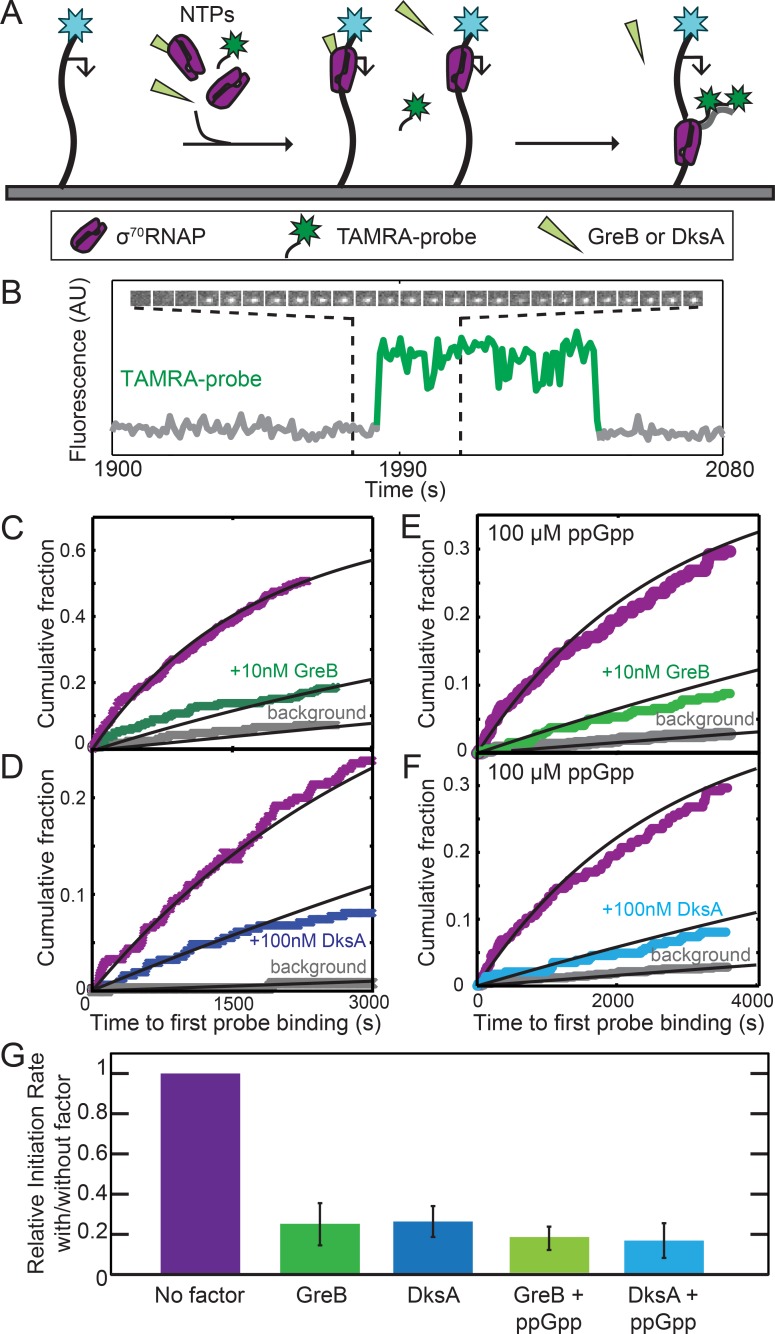
Figure 2. GreB and DksA equally inhibit transcription initiation from rrnB P1 at equal occupancies of σ70RNAP.
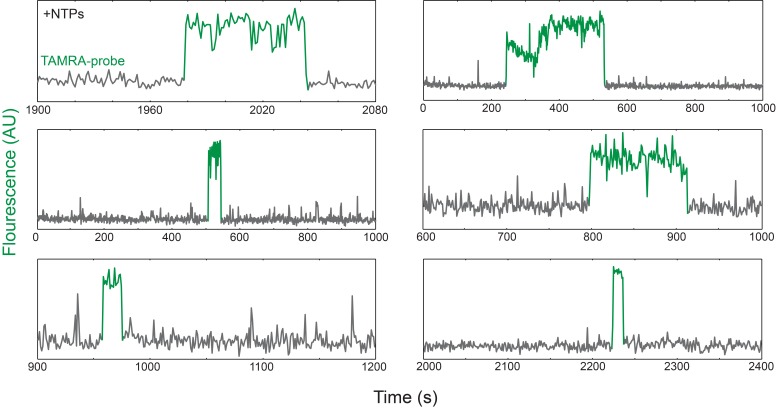
(A) Schematic of CoSMoS transcription initiation rate measurement in the presence of GreB or DksA. DNA molecules (314 bp) containing the rrnB P1 promoter (bent arrow) and labeled with AF488 (blue star) were tethered to the chamber surface via a biotin-neutravidin linkage. Initiation in the presence or absence of DksA, GreB, and/or ppGpp is detected as co-localization of two oligonucleotide probes labeled with TAMRA (green star) that hybridize near the 5′ end of the nascent transcript. (B) Example transcript probe fluorescence images (1.1 × 1.1 µm) taken at 5 s intervals (top) and corresponding intensity record (bottom) from the location of a single template DNA molecule. An objective image analysis algorithm (see Materials and methods) detected a spot of probe fluorescence at the times shown in green. (C–F) Cumulative distributions of the time until first probe detection on each DNA molecule. Only probe colocalization events 5 s or longer in duration were scored. Measurements were made in the absence (purple) or presence (green and blue) of secondary channel factors GreB (C, E) or DksA (D, F), without (C, D) or with (E, F) 100 μM ppGpp. Exponential fits (lines) are corrected (see Materials and methods) for non-specific binding of probe to the chamber surface measured at control locations that lack DNA molecules (gray). (G) Inhibition of initiation by secondary channel factors with and without 10 nM GreB, 100 nM DksA, and/or 100 μM ppGpp derived from experiments in (C–F), taken from the fit parameters (Table 2). Graph indicates the rate of initiation in the presence of the indicated factors (blue and green) relative to that measured in the same experiment without the factors (purple). Error bars: S.E.


