. 2020 Feb 18;9:e50845. doi: 10.7554/eLife.50845

Figure 8. Gut microbiotas of mammals representing distinct diets and phylogenetic origins can dehydroxylate catechols.

Catechol dehydroxylation of dopamine, DOPAC, (+)-catechin, and hydrocaffeic acid by gut microbiota samples from mammals spanning distinct diets and phylogenetic groups. Gut communities from 12 different mammals and three individuals per animal were cultured anaerobically for 96 hr in basal medium with 0.5 mM catechol at 37°C. The results summarize animals and individuals where the known dehydroxylation pathways examined in human gut Actinobacteria took place, as assessed by LC-MS/MS. Red indicates that metabolism took place in at least one of the individuals, and black indicates lack of metabolism, as assessed by the detection of the dehydroxylated metabolite using LC-MS/MS. The experiment was performed once. The phylogenetic tree was created using the aptg plugin in R and missing branches were added manually based on mammalian phylogeny. The icons were adapted under a Creative Commons license (https://creativecommons.org/licenses/by/3.0/) at phylopic (http://phylopic.org), including Alpaca logo (made my Steven Traver), Bison (Lukasiniho). Cow (Steven Traver), Dog (Tracy A Heath), Fox (Anthony Caravaggi), Guinea pig (Zimices), Mouse (Madeleine Price Ball), Pig (Steven Traver), Rabbit (Steven Traver), Rabbit (Steven Traver), Rat (Rebecca Groom), Sheep (Zimices), and Wolf (Tracy A Heath). All data can be found in Figure 8—source data 1.

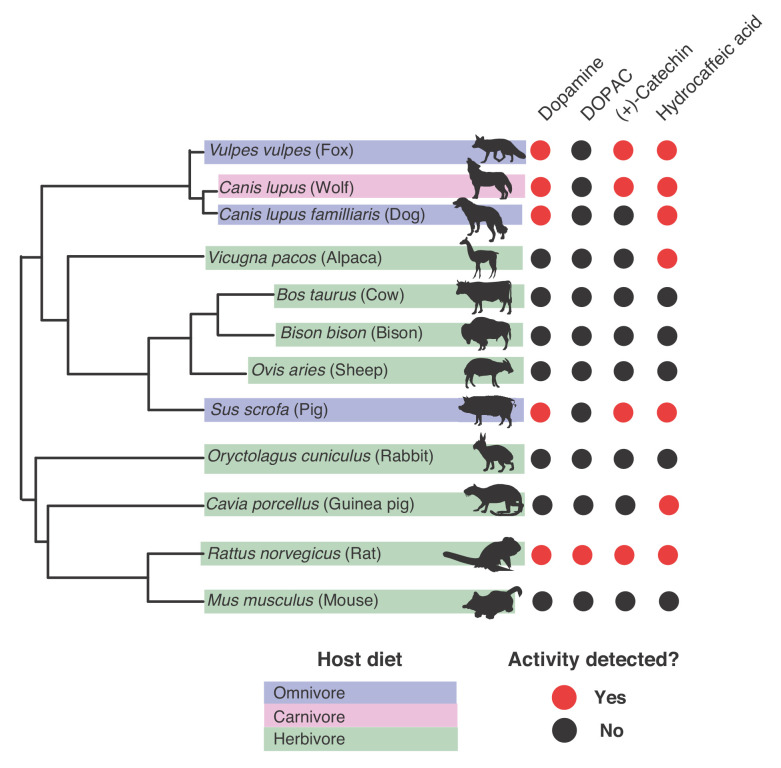
Figure 8—source data 1. Screen for catechol metbabolism by mammalian gut microbiota samples (Figure 8).

Figure 8.

Figure 8—figure supplement 1. Screen for catechol dehydroxylation by gut microbiota samples from diverse mammals.

Figure 8—figure supplement 1.

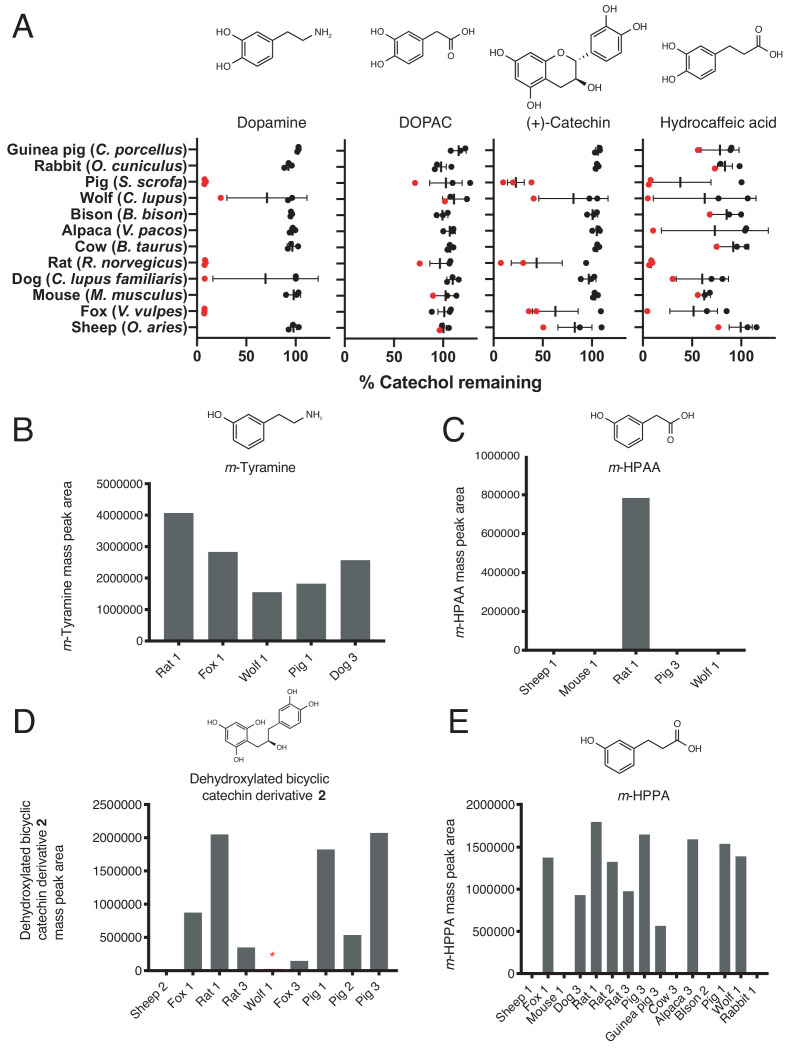
(A) Dehydroxylation of dopamine, DOPAC, (+)-catechin, and hydrocaffeic acid by gut microbiota samples from mammals spanning distinct diets and phylogenetic groups. Gut communities from n = 12 different mammals and n = 3 individuals per animal were cultured anaerobically for 96 hr in basal medium with 0.5 mM catechol at 37°C. Metabolism was then assessed using a colorimetric assay for catechol detection. Data were normalized to the sterile control. Each dot represents a different individual for each animal, and the red color indicates samples that were selected for further LC-MS/MS analysis. Bars display the mean and standard deviation. (B) m-Tyramine mass peak area in select mammalian gut microbiota samples incubated with dopamine and selected for LC-MS/MS analysis. Samples that displayed catechol depletion in A) performed dehydroxylation of dopamine. (C) m-HPAA mass peak area in select mammalian gut microbiota samples incubated with DOPAC and selected for LC-MS/MS analysis. Only the rat microbiota (individual 1) had activity towards DOPAC. (D) Dehydroxylated catechin derivative mass peak area in select mammalian gut microbiota samples incubated with (+)-catechin and selected for LC-MS/MS analysis. All samples selected for further analysis except the sheep microbiota displayed the full two-step conversion of (+)-catechin into the dehydroxylated derivative. The red asterisk indicates that the wolf microbiota had activity based on LC-MS/MS even though the mass peak area was lower than what is clearly visible with the current scale of the Y-axis. (E) C) m-HPPA mass peak area in select mammalian gut microbiota samples incubated with hydrocaffeic acid and selected for LC-MS/MS analysis. The screen for metabolism of all compounds across the animals was performed once. All data can be found in Source data – Figure 8.