. 2020 Jan 30;9:e53205. doi: 10.7554/eLife.53205

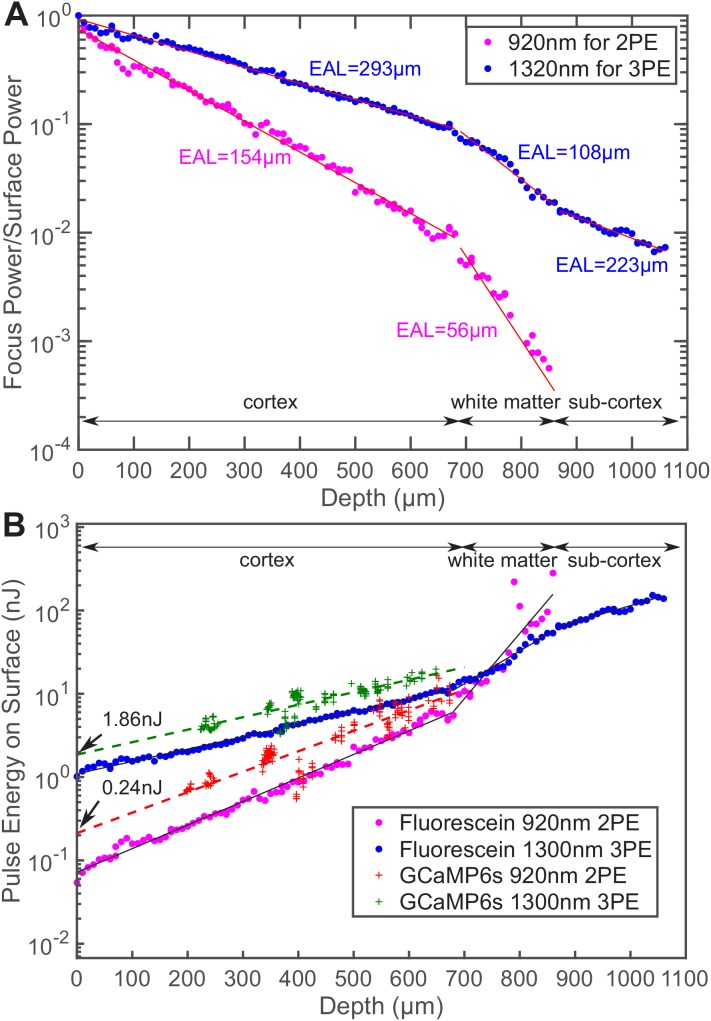
Figure 1. Comparison of the power attenuation of 1320 nm and 920 nm excitation light and their respective 3-photon and 2-photon excitation efficiency in the mouse brain.

(A) Power attenuation of 920 nm and 1320 nm excitation light in the mouse brain. The mouse brain vasculature was uniformly labeled with fluorescein dextran and imaged simultaneously by 920 nm 2PM and 1320 nm 3PM at precisely the same location. The fraction of excitation power reaching the focus from the brain surface (Focus Power/Surface Power) was calculated based on the attenuation of 2PE and 3PE signal with the imaging depth (Materials and methods). (B) The pulse energy required at the brain surface to generate the same 2PE and 3PE signal strength (0.1 signal photon detected per laser pulse) at different imaging depths, measured in fluorescein-labeled blood vessels (n = 1 shown) and GCaMP6s-labeled neurons (CamKII-tTA/tetO-GCaMP6s; n = 5 mice). The signal strength is scaled to 60 fs pulse duration for both 2PE and 3PE.

Figure 1—source data 1. A typical power attenuation with depth curve of 1320 nm and 920 nm excitation light in the mouse brain, plotted in Figure 1A.
Figure 1—source data 2. The excitation pulse energy at the brain surface required to generate 0.1 signal photon per pulse at different depths in the mouse brain, measured in fluorescein-labeled vasculature and plotted in Figure 1B.
Figure 1—source data 3. The excitation pulse energy at the brain surface required to generate 0.1 signal photon per pulse at different depths in the mouse brain, measured in the neurons of transgenic animals (CamKII-tTA/tetO-GCaMP6s) and plotted in Figure 1B.

Figure 1.

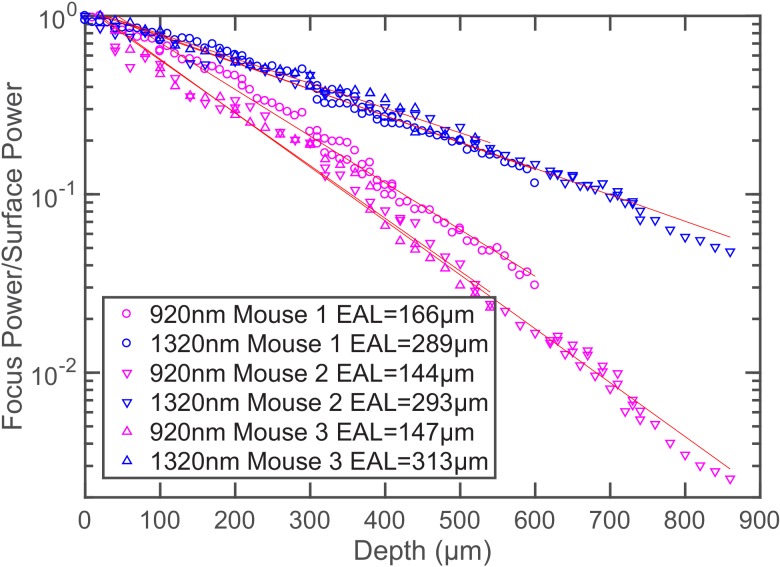
Figure 1—figure supplement 1. Additional power attenuation curves of 920 nm and 1320 nm excitation light in the mouse neocortex (n = 3, >12 weeks old mice, all males).

Figure 1—figure supplement 1.

Figure 1—figure supplement 1—source data 1. Additional power attenuation with depth curves of 1320 nm and 920 nm excitation light in the mouse neocortex, plotted in Figure 1—figure supplement 1.