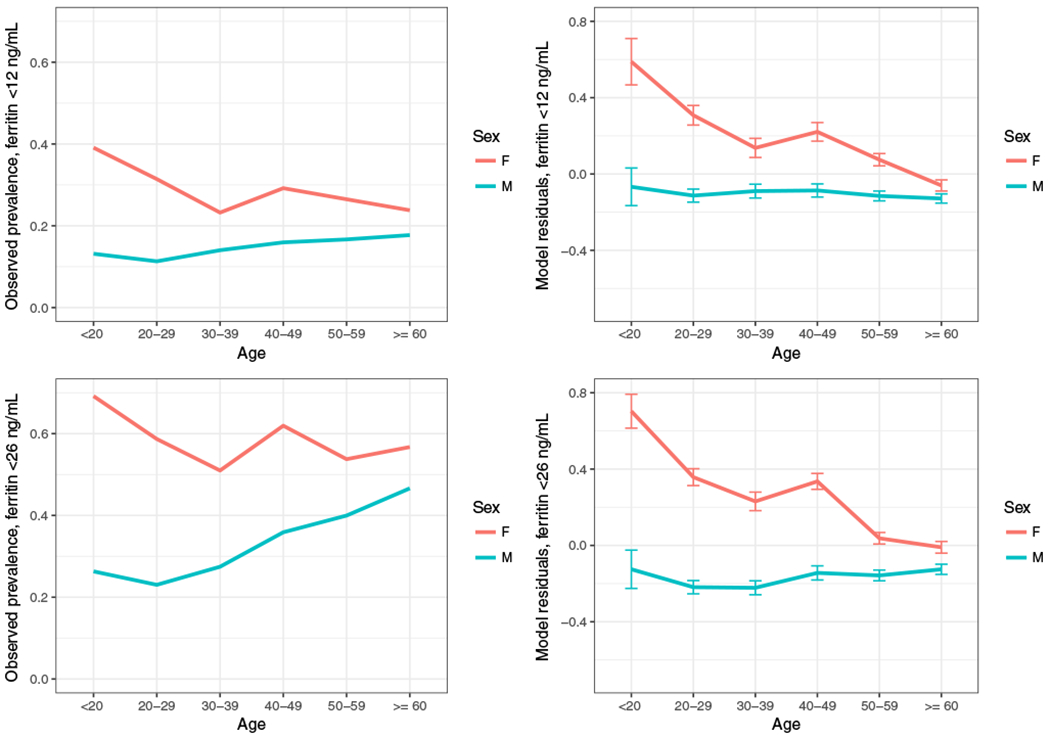
Fig. 1.

Observed and modeled risk for ferritin levels of less than 12 and less than 26 ng/mL in NHW subjects. Plots show the observed prevalence of ferritin levels of less than 12 (A) and less than 26 ng/mL (C) for NHW subjects, stratified by sex. Residuals from logistic regression models that omit age and sex show the unexplained variability for ferritin levels of less than 12 (B) and less than 26 ng/mL (D) for each pairing of sex and age. [Color figure can be viewed at wileyonlinelibrary.com]
