Figure 4.

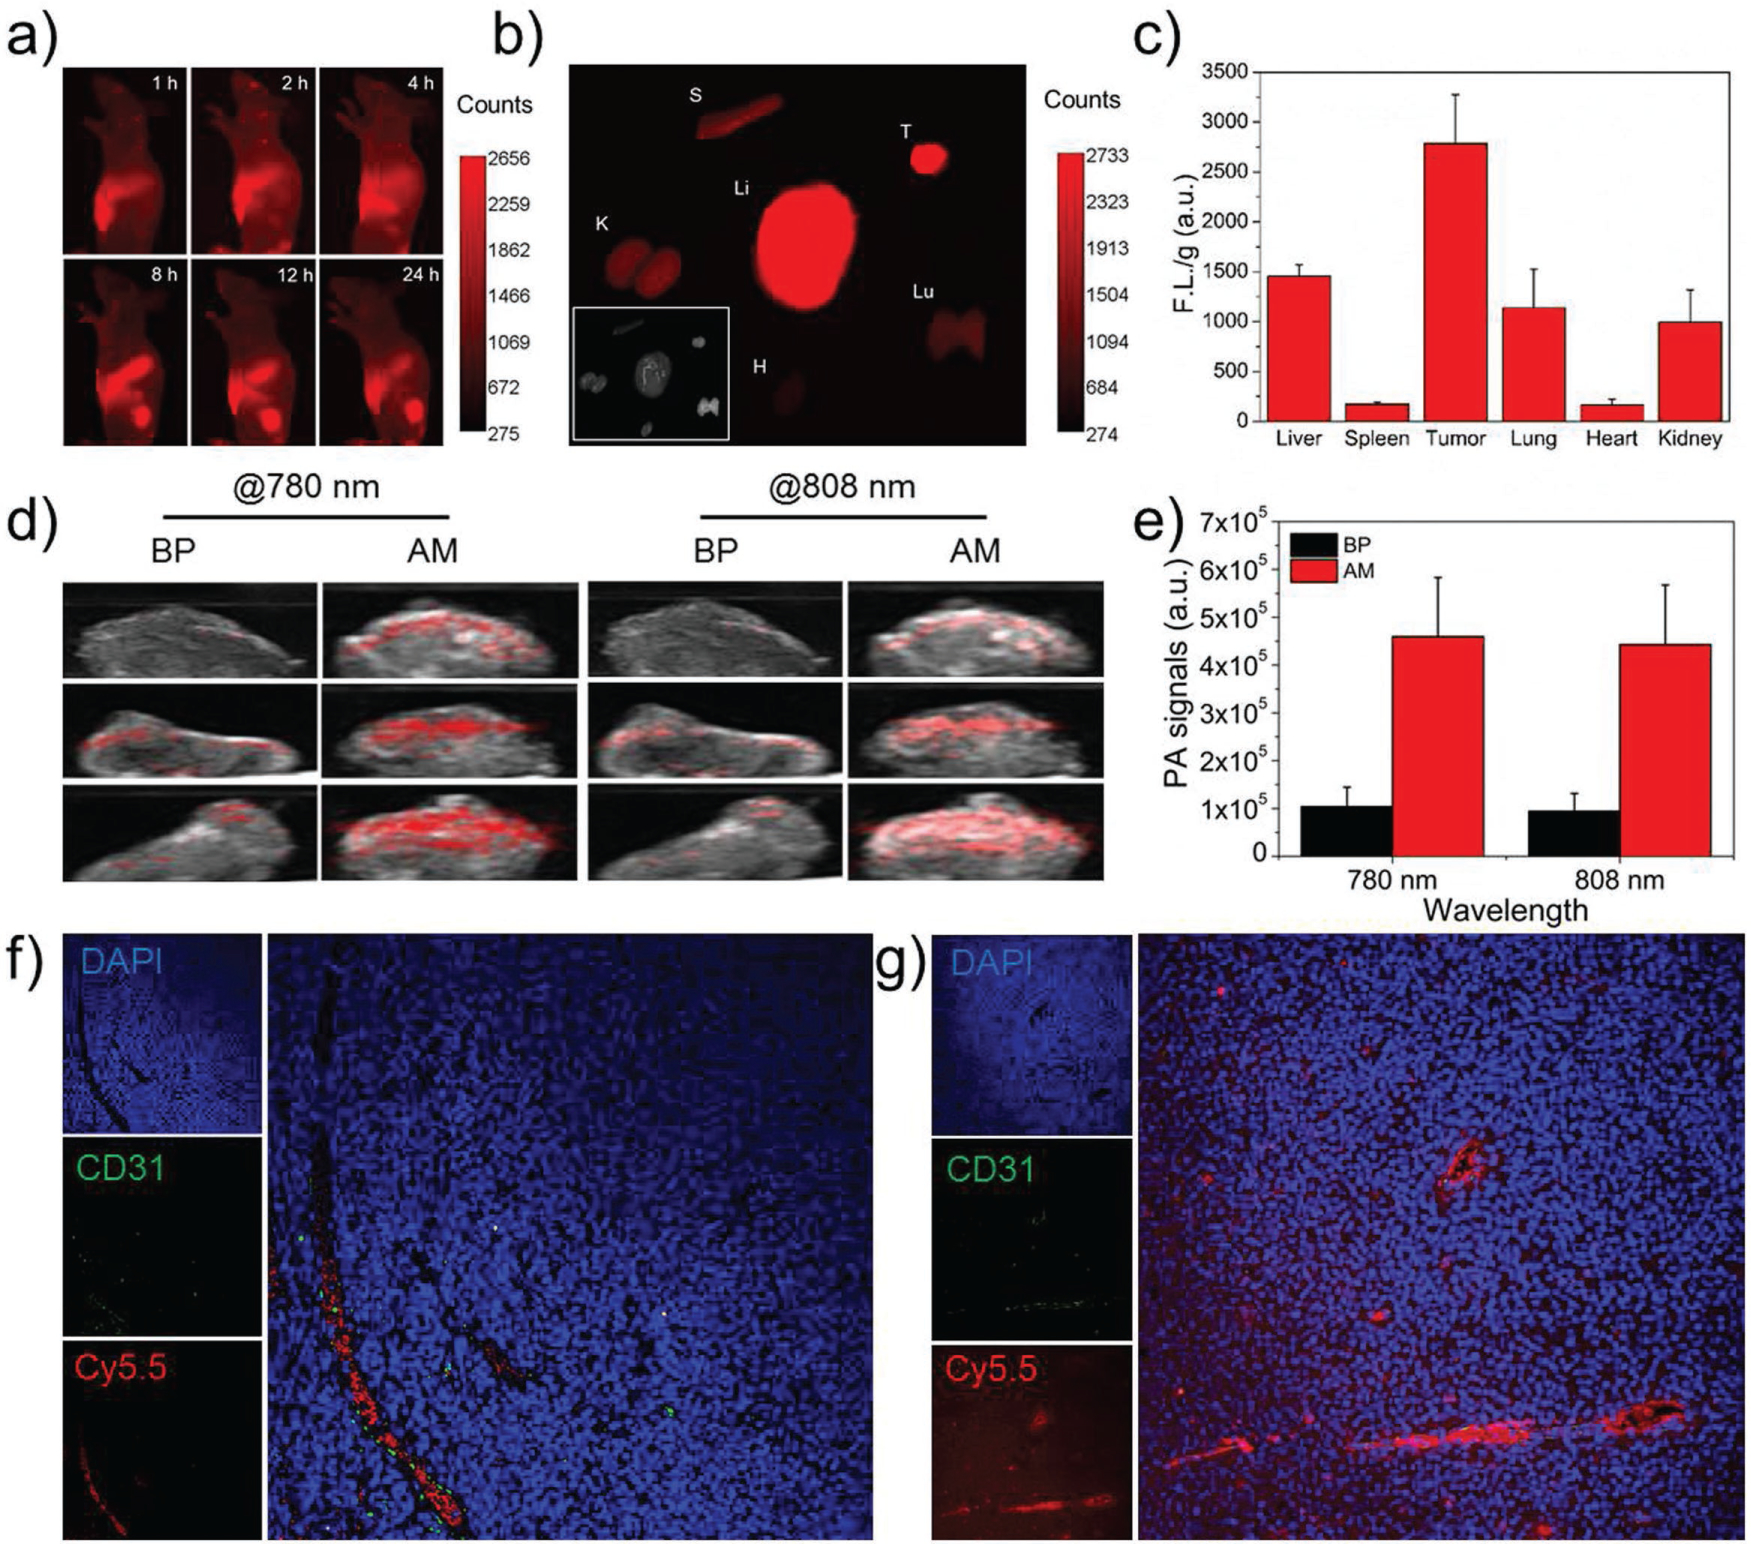
In vivo multimodal imaging and penetration results of AM-based NSs. a) In vivo fluorescence images of nude mice at different time points after i.v. injection with Cy5.5-labeled AM-PEG NSs. b) Ex vivo fluorescence images of the tumor and major organs at 24 h post-injection. Li: Liver; S: Spleen; T: Tumor; Lu: Lung; H: Heart; and K: Kidney. c) Semiquantitative biodistribution of Cy5.5-labeled AM-PEG NSs in nude mice detected by the average fluorescence intensity of tumors and major organs per gram. d) In vivo ultrasound and PA images of tumors after i.v. injection with AM-PEG NSs at wavelengths of 780 and 808 nm. BP-PEG NSs at the same dose (3 mg kg−1) were chosen as references. e) Quantitative analysis of each ROI signal in (d). Fluorescence images of the tumor sections of the MCF-7-tumor-bearing mouse sacrificed at 4 h post-injection of Cy5.5-loaded AM-PEG NSs: f) without, or g) with the irradiation of an 808 nm NIR laser (0.8 W cm−2, 10 min).
