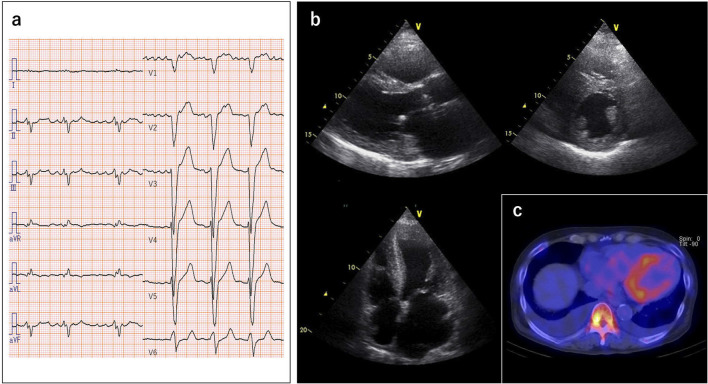
Figure 1.
(a) Electrocardiography showing intraventricular conduction delay and left-axis deviation. (b) Echocardiography showing diffuse left ventricular hypertrophy with an increased wall thickness of 12 mm and biatrial dilatation. (c) 99mTechnetium pyrophosphate scintigraphy showing grade 3 cardiac uptake SPECT/CT fusion imaging.

