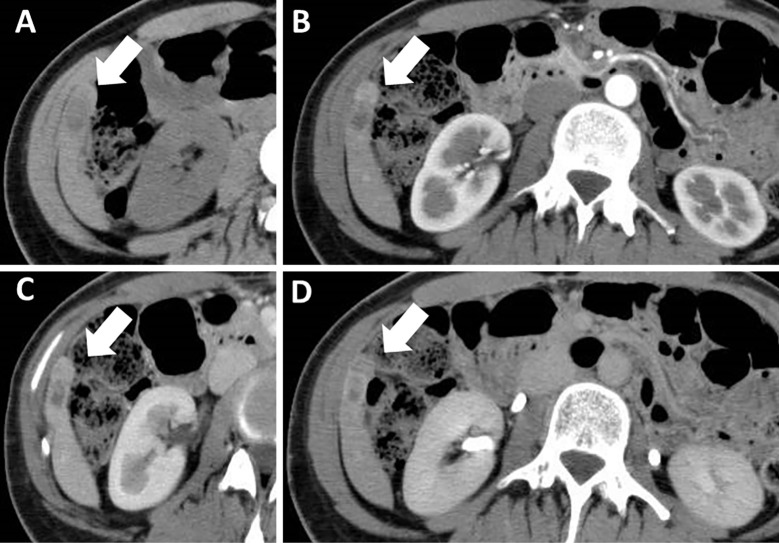
Figure 1.
Dynamic computed tomography performed 3 months before the patient’s admission showed a 11×25-mm, irregularly shaped mass (arrows) (A). The lesion was heterogeneously enhanced during the arterial phase (B) and washed out during the portal vein phase (C). It also showed hypointensity at the equilibrium phase (D).

