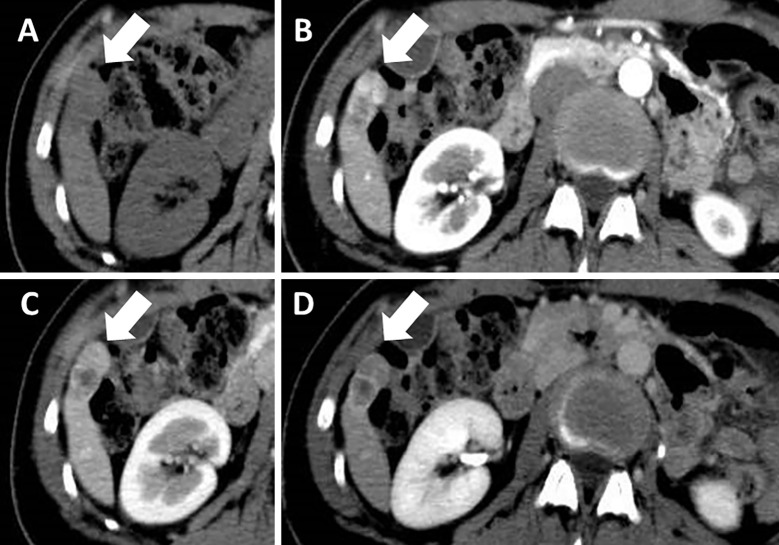
Figure 5.
Dynamic computed tomography at the time of admission showed an enlarged tumor (17×34 mm; arrows) (A). The lesion was heterogeneously enhanced during the arterial phase (B) and washed out during the portal vein phase (C). It also presented as a hypointense lesion at the equilibrium phase (D).

