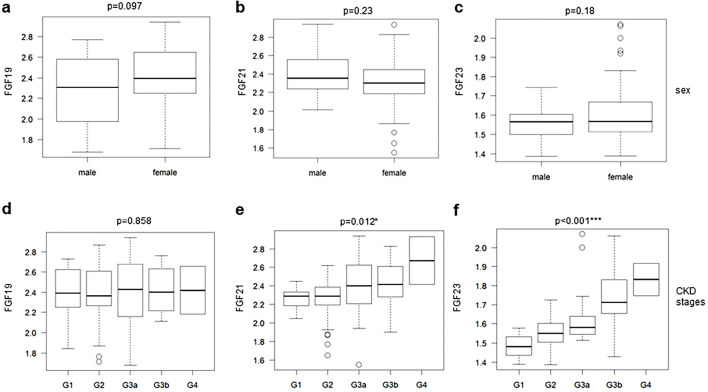
Figure 1.
The tendency of serum endocrine FGF levels to be associated with general parameters in clinical observations. Endocrine FGF levels stratified by sex (a-c) and CKD stages (d-f) are shown as box plots. The values shown are medians, interquartile ranges (IQR), minimal and maximal values, and outliers (defined as values between 1.5 and 3 times IQR and represented by circles). P values were calculated by Student’s t-test (sex) and the Jonckheere-Terpstra test (CKD stage).

