FIGURE 6.

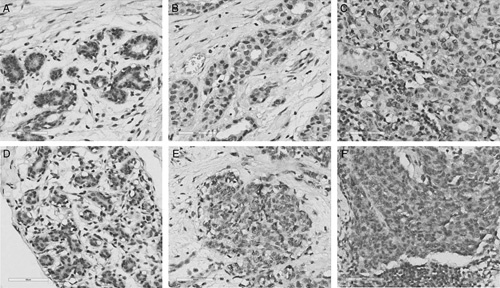
Representative immunostaining patterns of RAC2 and PTGDS in normal epithelium of the breast (A, D), corresponding carcinoma (B, E), and metastatic lymph node (C, F) (A–C, RAC2; D–F, PTGDS) (×400, scale bars; 60 μm).

Representative immunostaining patterns of RAC2 and PTGDS in normal epithelium of the breast (A, D), corresponding carcinoma (B, E), and metastatic lymph node (C, F) (A–C, RAC2; D–F, PTGDS) (×400, scale bars; 60 μm).