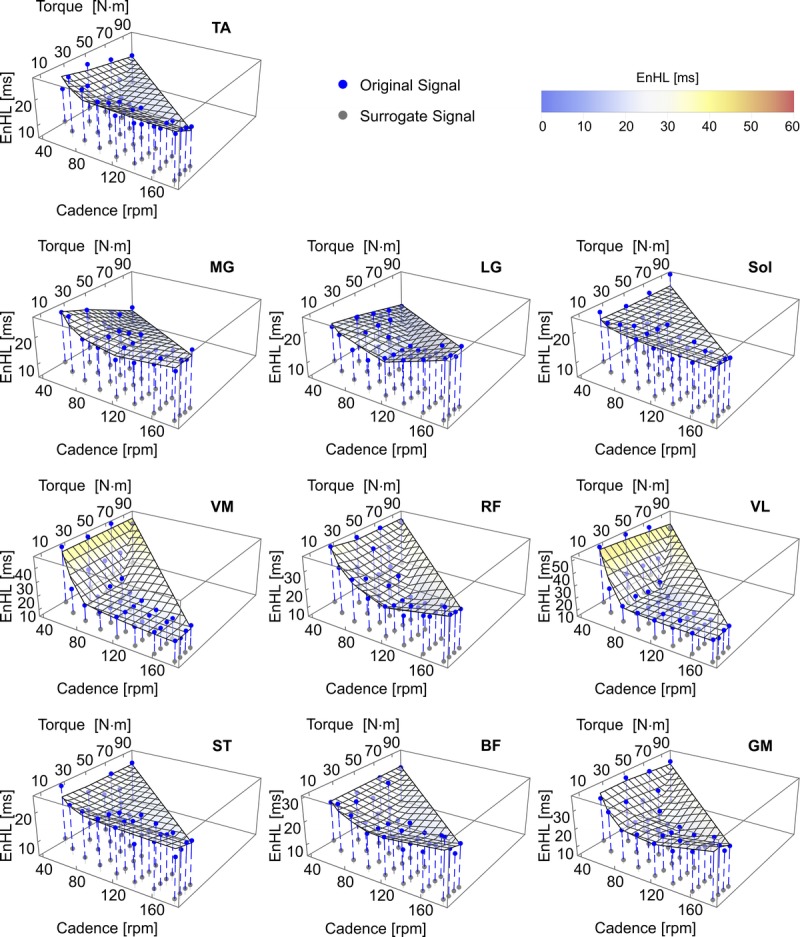
FIGURE 3.

EnHL values for excitation patterns (blue points) and phase randomized surrogate signals (gray points) of individual muscles recorded for each cadence–crank torque cycling condition. The overlaid surface represents the excitation pattern EnHL values predicted as a function of cadence and torque by MARS analysis. Equations for the surface and associated goodness of fit values are provided in Table 2. See Supplemental Digital Content 3 for animations of the graphics rotating through different viewpoints, http://links.lww.com/MSS/B706 and Supplemental Digital Content 4 for animations of the graphics including data points indicating the group inter-quartile ranges, http://links.lww.com/MSS/B707.
