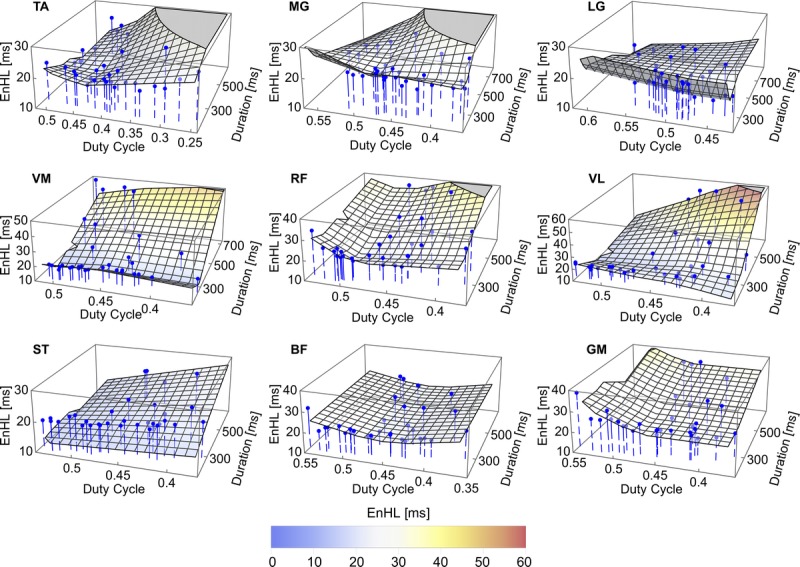
FIGURE 4.

EnHL values for excitation patterns (blue points) of individual muscles as a function of excitation duration and duty cycle. The overlaid surface represents the excitation pattern EnHL values predicted as a function of excitation duration and duty cycle by MARS analysis. Equations for the surface and associated goodness of fit values are provided in Table 3. See Supplemental Digital Content 5 for animations of the graphics rotating through different viewpoints, http://links.lww.com/MSS/B708.
