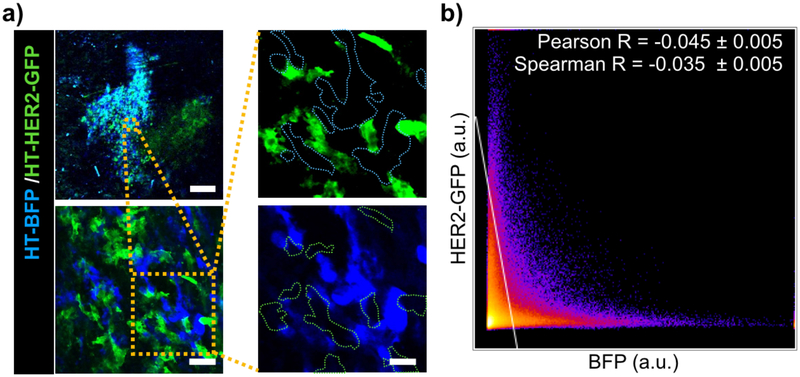
Figure 3. IVM enables segmentation of intermixed HER2− and HER2+ tumor cells in a mosaic xenograft model.
(a-b) HT-BFP and HT-HER2-GFP cells were mixed 1:1, injected into the dorsal window chamber of nu/nu mice, and imaged by IVM upon tumor formation. Representative IVM with single-cell segmentation (a) and corresponding pixel-by-pixel analysis of BFP and GFP fluorescence intensities (b) show minimal overlap and an ability to distinguish HER2− and HER2+ cells. Data are means ± s.e.m. from all pixels, scale bars: top left panel=0.5 mm; bottom left panel=50 μm; right panels=20 μm.

