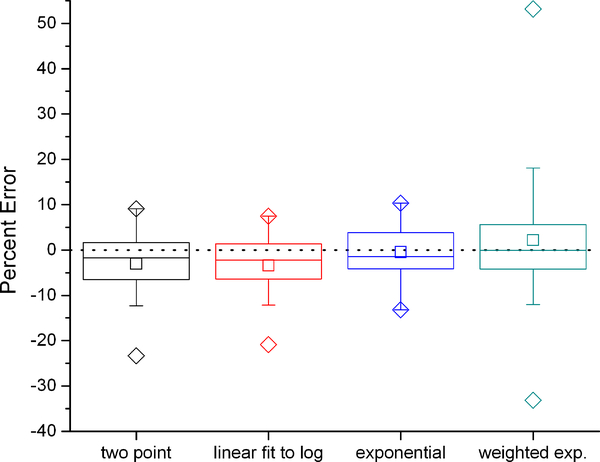
Figure 2:
Percent error in VCO2 using different methods to calculate the isotope turnover rates compared to the criterion measure IC with the intercept method. Box represents interquartile range with center line at median and center square at mean. Error bars represent 5’th and 95’th percentile, diamonds maximum and minimum values.

