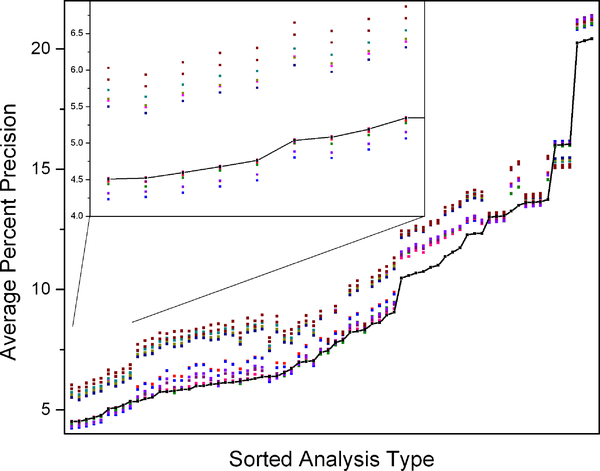
Figure 4:
Average percent precision of multiple combinations of approaches and equations to estimate dilution spaces, elimination rates, and VCO2 with application of different methods of utilizing 17O abundances to correct for background fluctuations (intercept method). The black trace shows the average percent precision of each combination of equations without any correction and each color represents a different background correction approach. The inset shows an enlargement of the data for the most precise combinations with and without 17O background fluctuation correction.

