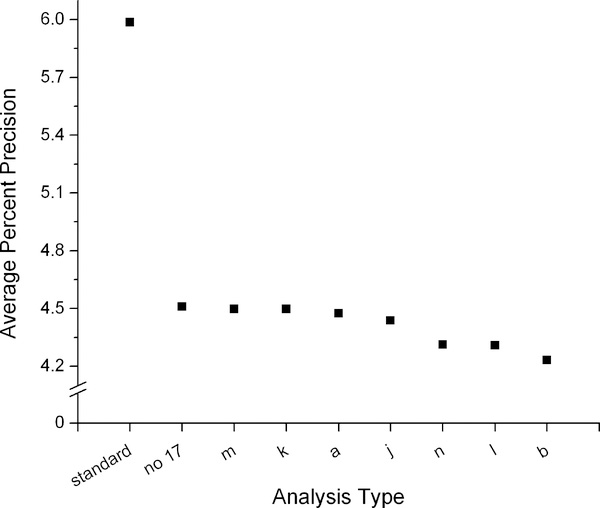
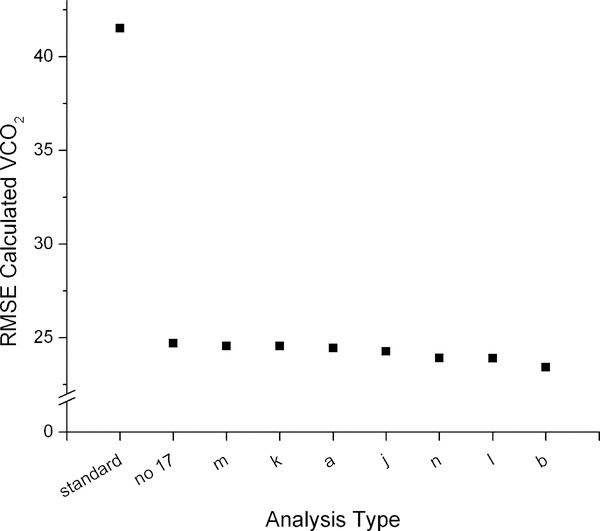
Figure 5:
Average percent precision (left) and root mean squared error (RMSE, right) of VCO2 calculated from DLW data compared to the criterion measure IC. The most precise combination of calculations without background fluctuation (no 17) is compared with the seven best methods of background fluctuation correction using the 17O data (model type listed on the x axis). VCO2 determined using a standard approach (left most point) is included for comparison.


