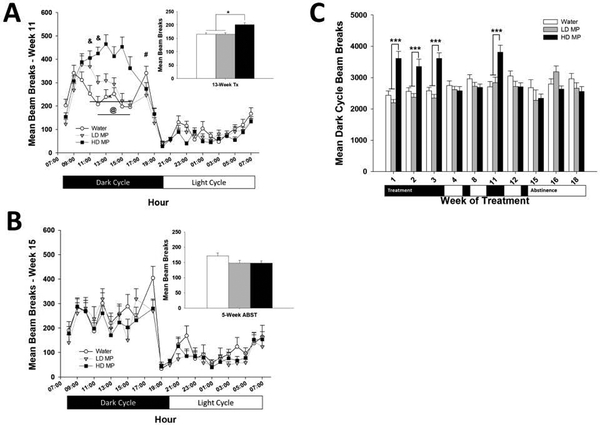
Figure 3:
Circadian Activity (n=24 per group). (A) Hourly circadian locomotor activity during week 11 of treatment presented as Mean + SEM (# - LD < W, p<.05; ^ - HD > W, p<.001; @ - HD > LD, p<.05; & - LD > W, p<.05). Insert: Total activity during week 11 of treatment presented as Mean + SEM (*p<.05). (B) Hourly circadian locomotor activity during the second week of prolonged abstinence (week 15) presented as Mean + SEM. Insert: Total activity during week 15 presented as Mean + SEM. (C) Beam breaks during the dark phase of the light cycle presented as Mean + SEM (***p<.001).

