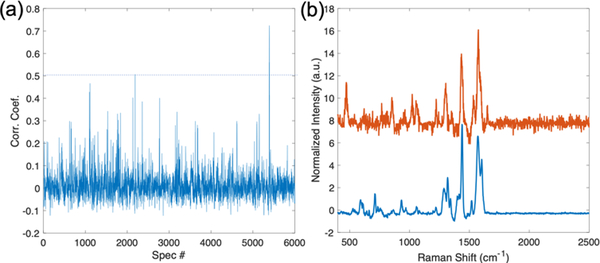
Figure 2.
(a) Pearson correlation coefficients between AHP reference spectrum and each spectrum in the SERS chromatogram shown in Figure 1b. The spectrum that exceeds the threshold (dashed line: Corr. Coef. = 0.5) is shown in (b). (b) The reference SERS spectra of AHP (blue) and the highest correlation spectrum (Red) from the LC-SERS experiment in (a) show strong agreement.

