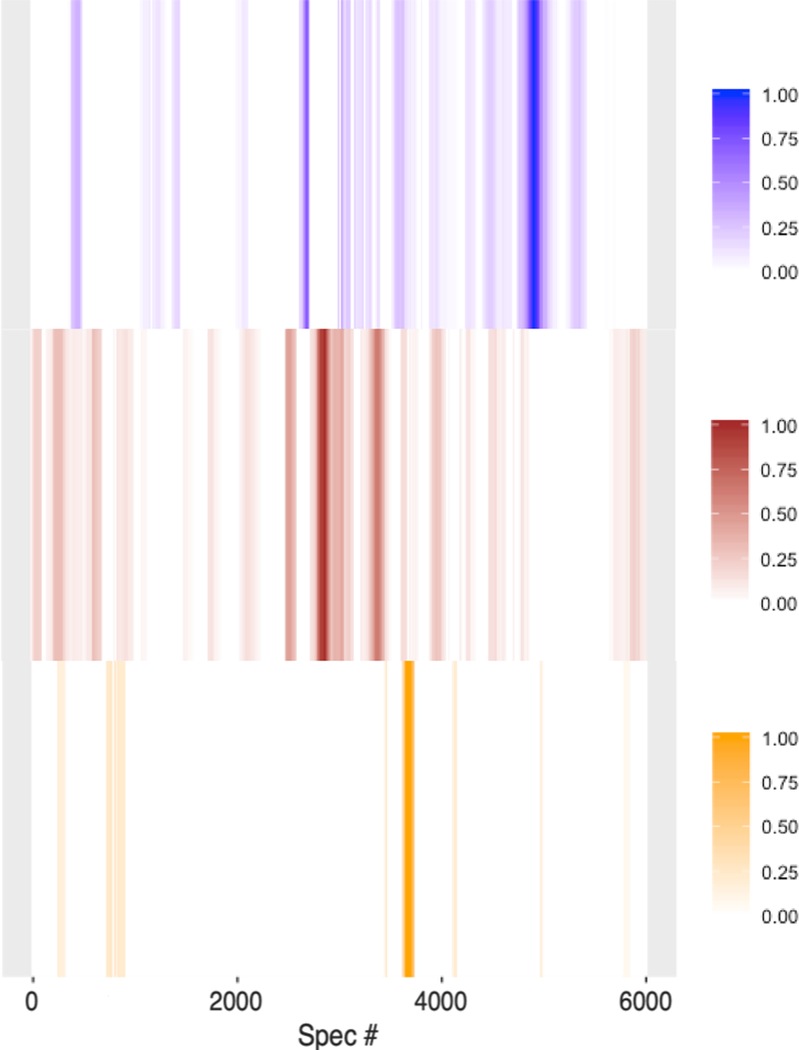
Figure 4.
Bar code plots of tumors MMTV-Wnt1 (blue, n=4), MMTV-Neu (brown, n=4) and normal mammary gland sample (orange, n=4). Bar codes represent the reproducible SERS signals from at least 3 replicate LC-SERS runs. Color scales represent cumulative pairwise correlation coefficients normalized between 0 and 1.

