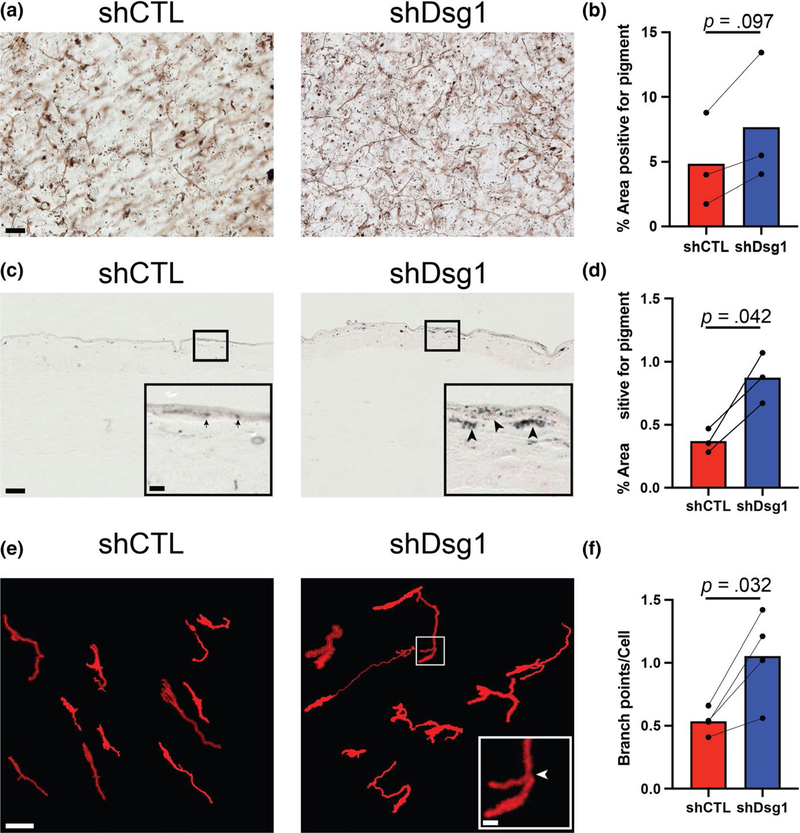
FIGURE 1.
MCs incorporated into Dsg1-deficient 3D organotypic cultures exhibit increased pigment distribution and dendrite branching compared with controls. (a) Silencing keratinocyte (KC) Dsg1 (shDsg1) resulted in increased pigment deposition throughout the organotypic cultures compared with controls (shCTL). (b) Quantification of the area positive for pigment in the images from 3D organotypic cultures prepared using the whole-mount method trends toward an increase in area positive for pigment in Dsg1-silenced cultures compared with controls. Areas selected for analysis excluded melanocytes (MCs) to focus on released pigment. (c) Fontana Masson staining of sections from shCTL and shDsg1 cultures shows increased pigment staining in the shDsg1 compared with shCTL cultures. Insets are provided to allow more detailed visualization of the darker stained, larger aggregates of pigment in the shDsg1 (arrowheads) compared with shCTL (arrows) cultures, scale bar for insets = 10 μm. (d) Quantification of the area positive for pigment from C. (e) Dsg1 knockdown in KCs increased the average number of branch points per MC in 3D organotypic cultures compared with controls. The open-source (FIJI) software Simple Neurite Tracer was used to trace tdTomato-expressing MCs in 3D as described in the Materials and Methods to aid visualization and analysis of MC dendrite branching and to exclude background fluorescence. Scale bar for insets = 10 μm. (f) Quantification of the average number of branch points per MC shows increased branch points in Dsg1-silenced cultures compared with controls. A histogram of the relative occurrence of 0 to 8 branch points per cell is shown in Figure S1. Data were statistically analyzed using the two-tailed paired t test. All scale bars except insets = 50 μm

