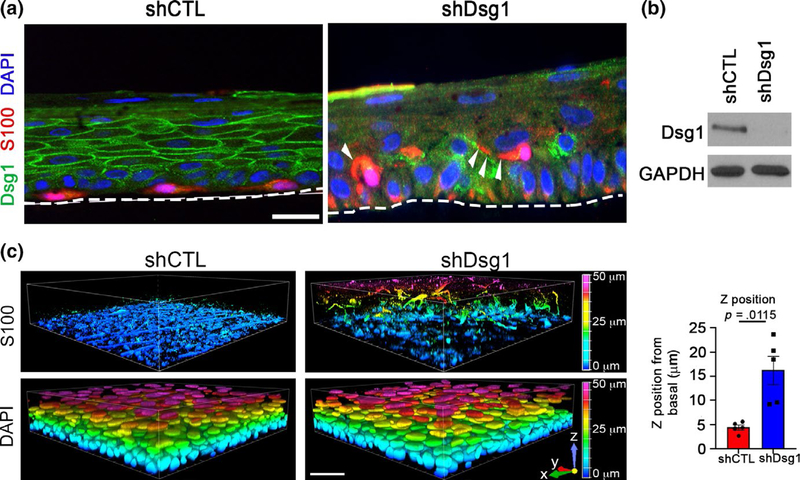
FIGURE 5.
MCs are mislocalized within the 3D skin structure when KC Dsg1 is reduced. (a) Silencing Dsg1 (shDsg1) in KCs cocultured with MCs in 3D organotypic cultures resulted in mislocalization of MCs from basal to suprabasal layers compared with controls (shCTL). Dsg1 marks KCs and is mostly absent in the shDsg1 culture, S100 marks MCs, and DAPI marks nuclei. White arrowheads indicate MC dendrites. Scale bar = 10 μm. (b) Immunoblot of Dsg1 protein expression for organotypic cultures pictured in C. GAPDH is a loading control. (c) Images of 3D organotypic cultures of KCs and MCs prepared using the whole-mount method. S100 marks MCs, showing their movement into the suprabasal layers upon Dsg1 reduction (N = 5). Horizontal scale bar = 50 μm, vertical color scale bar = Z position. The graph represents the mean and SEM of movement in the Z position (μm) away from the basement membrane of at least 20 cells in each of 5 organotypic cultures

