Fig. 3.
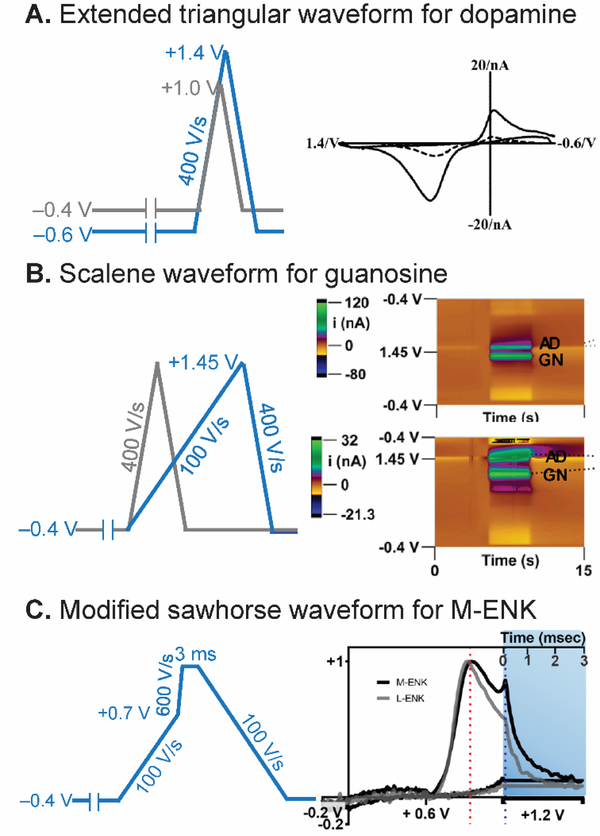
Strategy 1: Waveform Optimization. (A) Extended triangular waveform for dopamine detection. The waveform scanned from −0.6 V to +1.4 V (blue) yielded 5-time higher sensitivity for dopamine than the traditional waveform scanned from −0.4 V to +1.0 V (gray). CV is reproduced from 43 with permission from The Royal Society of Chemistry. Note: Axes are flipped in a different convention than currently used. (B) Scalene waveform for guanosine-adenosine co-detection. Slower forward scan (100 V/s) significantly discriminated anodic peak between guanosine (GN) and adenosine (AD). Color plots are reprinted from 50. Copyright 2019 American Chemical Society. (C) Modified sawhorse waveform for M-ENK detection. Slower scan rate portion decreased interferent signals, and chronoamperometric portion distinguished between M-ENK and L-ENK. Reprinted from 52. Copyright 2019 American Chemical Society.

