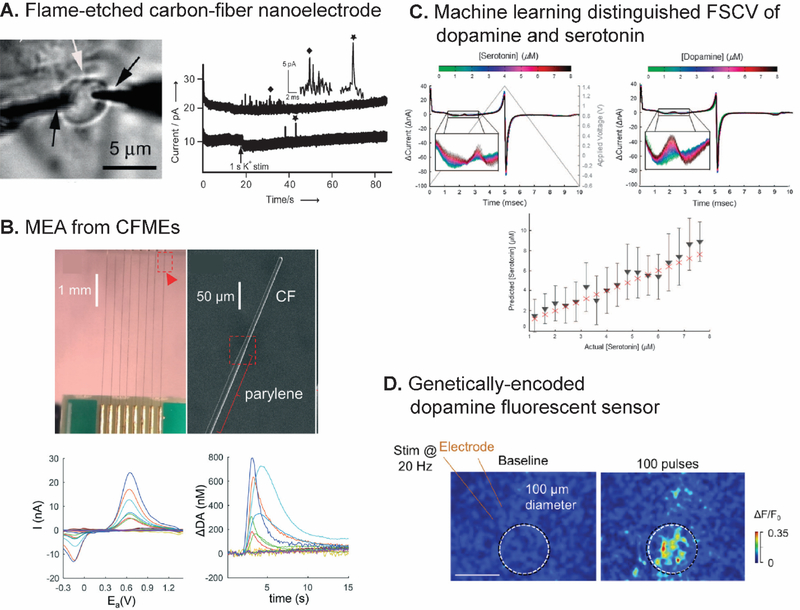
Fig. 6.
New challenges for FSCV detection of neurotransmitters. (A) Two flame etched carbon-fiber nanoelectrodes revealed quantal spike in amperograms from vesicular exocytosis from basal and apical pole of a single varicosity. Reproduced from 113 with the permission from Wiley. (B) MEA from eight CFMEs assembled on a printed circuit board. SEM image showed parylene coating to control the exposed length of the CFME. CVs and calculated concentration-time traces were obtained from different channels in the MEA. Reproduced from 122 with the permission from the Royal Society of Chemistry. (C) First-derivative FSCV of dopamine and serotonin that multivariate regression machine learning distinguished and quantified their concentration. Bottom graph shows that the actual serotonin concentrations (red crosses) were in the 90% confidence interval (black triangles and bars) predicted by the model obtained from the training set. Reproduced from 128 with the permission from Springer Nature. (D) False color images of fluorescence responses of an electrically-stimulated neuron in acute mouse brain slices with genetically encoded GPCR-activation-based dopamine sensor (scale bar: 100 μm). Reproduced from 132 with the permission from Elsevier.

