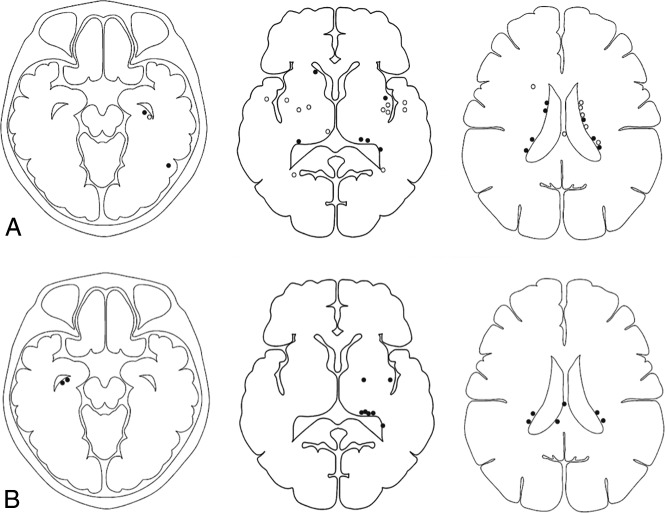
Fig 3.
Topographic analysis showing the distribution of initial and recurrent hemorrhagic sites. A, Topographic analysis of initial hemorrhagic sites for those with (black dots) and those without (white dots) recurrent hemorrhage. B, Another topographic analysis shows the distribution of recurrent hemorrhagic sites (black dots). Four patients with recurrent hemorrhage attributable to intracranial aneurysm rupture are not shown in this analysis.

