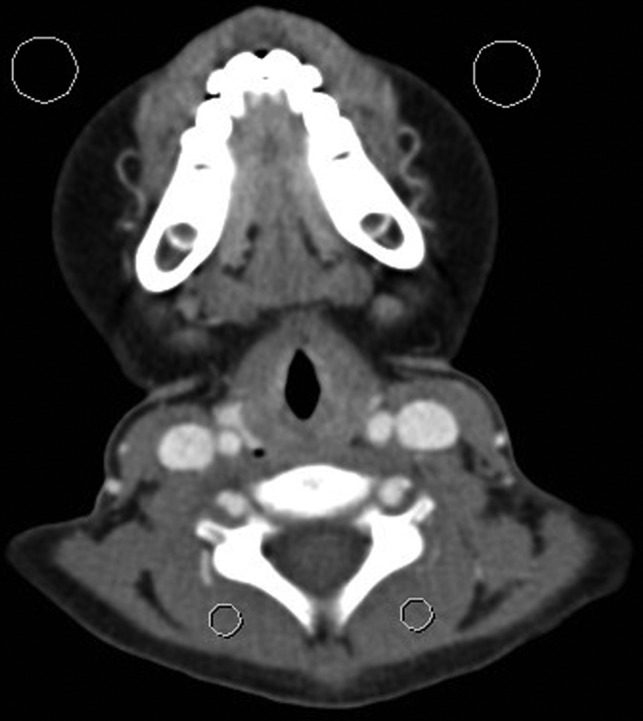
Fig 1.

Representative CT image of a 6-year-old boy at the level of the vocal cords for assessment of the signal-to-noise ratio. Background noise was estimated as the average SD in Hounsfield units of 2 ROIs drawn over the air anterior to the patient (large circles). Signal was estimated as the average attenuation in Hounsfield units of 2 ROIs drawn over the paraspinal musculature (small circles).
