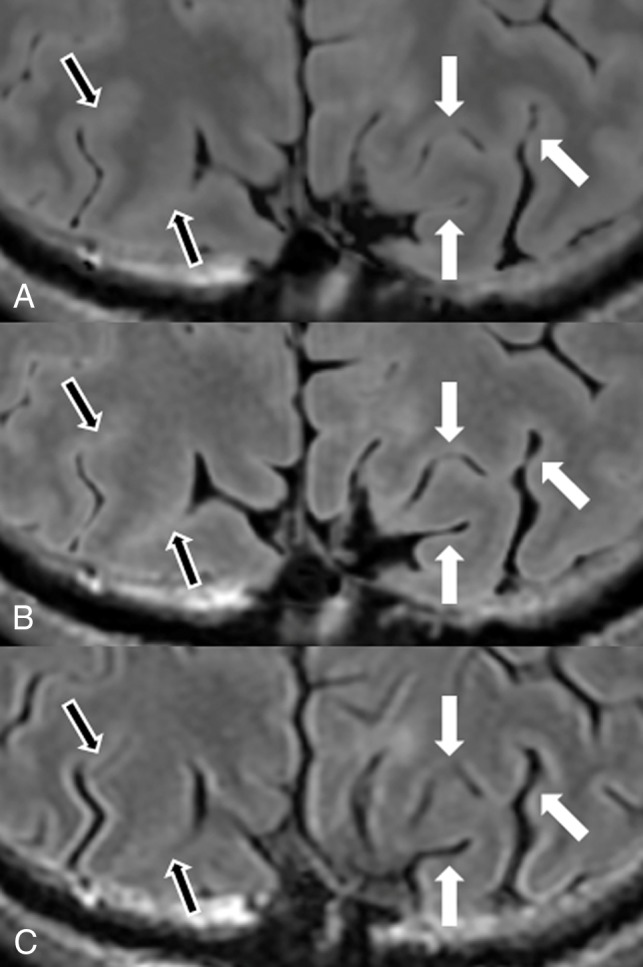
Fig 4.

Magnified images from Fig 2. Synthetic FLAIR (A), DL-FLAIR (B), and conventional FLAIR (C) images are shown. Sulci are wider in B and C in some areas than they are in A (white arrows). However, for areas with tight sulci on the conventional FLAIR image (C), the sulci are tighter and more hyperintense on both synthetic FLAIR (A) and DL-FLAIR (B) images than they are on the conventional FLAIR image (black arrows).
