Figure 1.
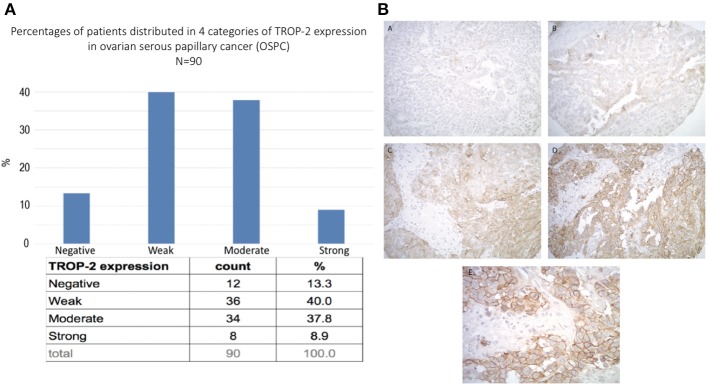
(A) Trop-2 expression in tissue micro array of 90 EOC samples. (B) Representative IHC images from the tissue microarray show no Trop-2 immunostaining (score 0) (A), weak focal (score 1) (B), moderate focal (score 2) (C) and strong diffuse (score 3) (D) membranous Trop2 expression. (E) higher magnification image shows membranous localization of Trop2. Original magnification: 200x (A–D) and 400x (E).

