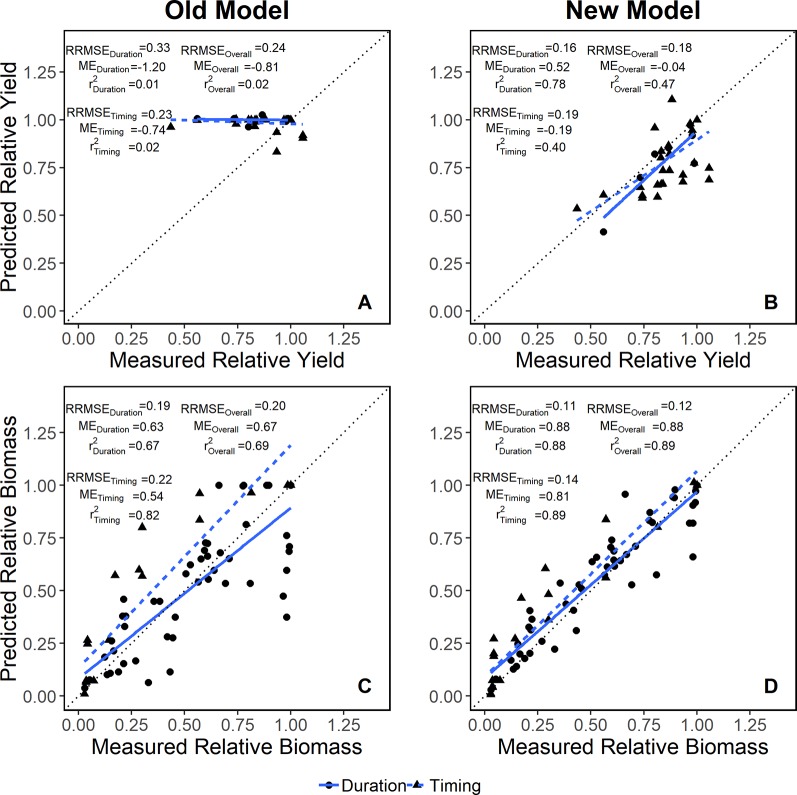
Figure 2.
Model evaluation for yield (A, B) and biomass (C, D) data in both flooding duration (solid blue line) and timing (dashed blue line) studies relative to a 1:1 reference line (dotted black line). Relative root mean square error (RRMSE), modeling efficiency (ME) and R2 for each dataset are included in the panel.

