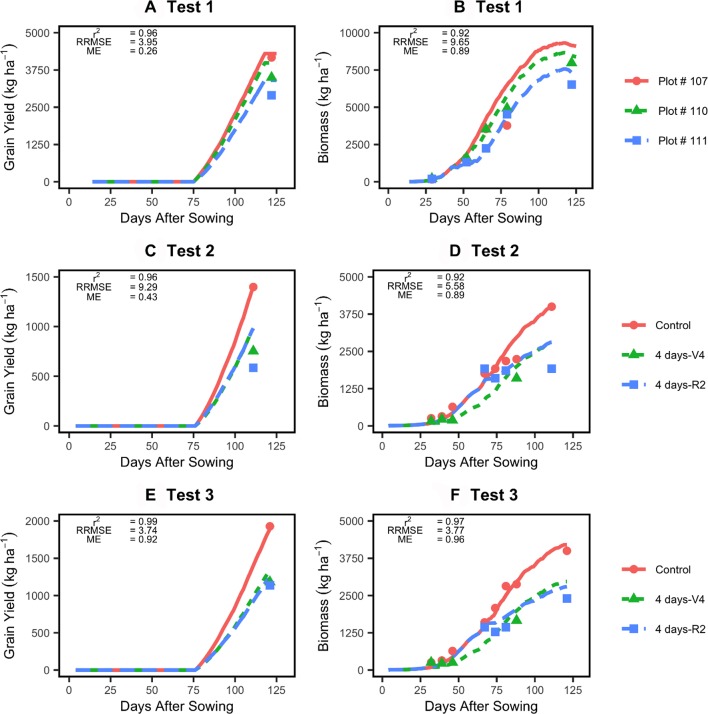
Figure 5.
Testing of the improved model (lines) against two independent datasets (points). Left panels show model evaluation for yield (A, C, E) and right panels model evaluation for in-season biomass accumulation (B, D, F). See Table 1 for experimental details.

